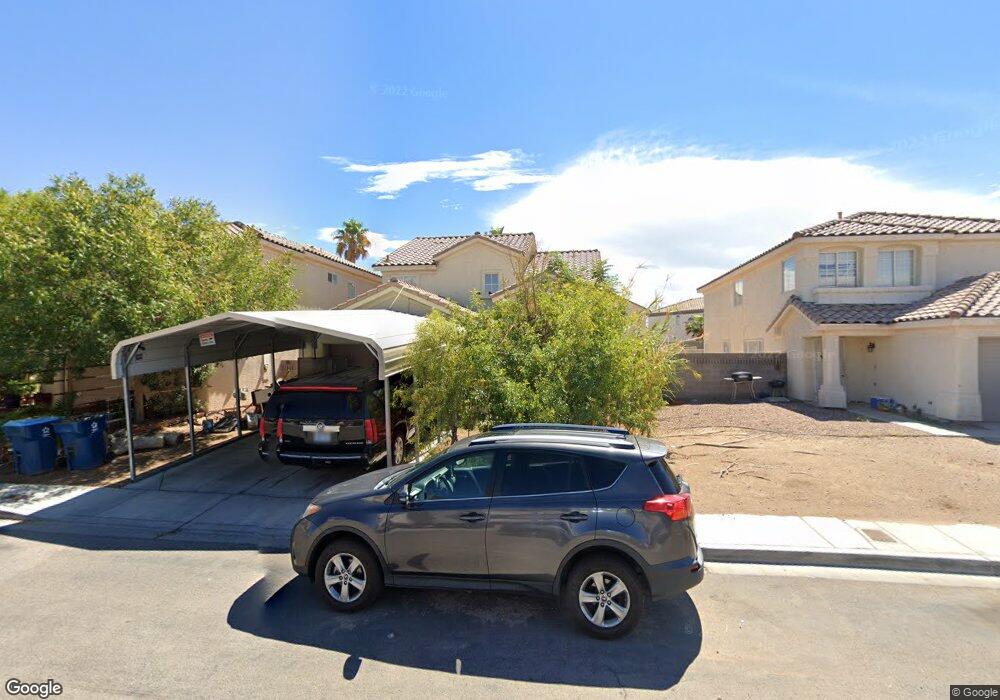
3911 Bolles Harbor St Las Vegas, NV 89104
Estimated Value: $338,000 - $440,000
3
Beds
3
Baths
1,870
Sq Ft
$212/Sq Ft
Est. Value
About This Home
This home is located at 3911 Bolles Harbor St, Las Vegas, NV 89104 and is currently estimated at $396,577, approximately $212 per square foot. 3911 Bolles Harbor St is a home located in Clark County with nearby schools including Walter V. Long Elementary School, Jerome Mack Middle School, and Chaparral High School.
Ownership History
Date
Name
Owned For
Owner Type
Purchase Details
Closed on
Jul 26, 2010
Sold by
Accredited Reo Properties Llc
Bought by
Zeleke Mesa M
Current Estimated Value
Purchase Details
Closed on
Jun 29, 2010
Sold by
Lozoya Yolanda
Bought by
Accredited Reo Properties Llc
Purchase Details
Closed on
Jul 2, 2007
Sold by
Lozoya Yolanda
Bought by
Lozoya Yolanda
Home Financials for this Owner
Home Financials are based on the most recent Mortgage that was taken out on this home.
Original Mortgage
$184,000
Interest Rate
6.5%
Mortgage Type
New Conventional
Purchase Details
Closed on
Sep 26, 2006
Sold by
Lozoya Yolanda and Lozoya Efren
Bought by
Lozoya Yolanda
Purchase Details
Closed on
Aug 19, 1996
Sold by
Plaster Development Company Inc
Bought by
Lozoya Efren and Lozoya Yolanda
Home Financials for this Owner
Home Financials are based on the most recent Mortgage that was taken out on this home.
Original Mortgage
$118,456
Interest Rate
8.42%
Mortgage Type
FHA
Create a Home Valuation Report for This Property
The Home Valuation Report is an in-depth analysis detailing your home's value as well as a comparison with similar homes in the area
Home Values in the Area
Average Home Value in this Area
Purchase History
| Date | Buyer | Sale Price | Title Company |
|---|---|---|---|
| Zeleke Mesa M | $100,000 | Fidelity Rainbow | |
| Accredited Reo Properties Llc | $87,857 | Accommodation | |
| Lozoya Yolanda | -- | National Alliance Title | |
| Lozoya Yolanda | -- | National Alliance Title | |
| Lozoya Efren | $120,000 | United Title |
Source: Public Records
Mortgage History
| Date | Status | Borrower | Loan Amount |
|---|---|---|---|
| Previous Owner | Lozoya Yolanda | $184,000 | |
| Previous Owner | Lozoya Efren | $118,456 |
Source: Public Records
Tax History Compared to Growth
Tax History
| Year | Tax Paid | Tax Assessment Tax Assessment Total Assessment is a certain percentage of the fair market value that is determined by local assessors to be the total taxable value of land and additions on the property. | Land | Improvement |
|---|---|---|---|---|
| 2025 | $1,147 | $86,182 | $26,250 | $59,932 |
| 2024 | $1,114 | $86,182 | $26,250 | $59,932 |
| 2023 | $1,114 | $86,450 | $29,400 | $57,050 |
| 2022 | $1,082 | $75,628 | $23,450 | $52,178 |
| 2021 | $1,051 | $70,793 | $21,000 | $49,793 |
| 2020 | $1,017 | $68,707 | $19,250 | $49,457 |
| 2019 | $987 | $68,202 | $19,250 | $48,952 |
| 2018 | $959 | $60,117 | $13,300 | $46,817 |
| 2017 | $1,699 | $57,920 | $10,500 | $47,420 |
| 2016 | $909 | $50,783 | $8,750 | $42,033 |
| 2015 | $906 | $45,810 | $8,050 | $37,760 |
| 2014 | $880 | $33,250 | $5,250 | $28,000 |
Source: Public Records
Map
Nearby Homes
- 2356 Grannis Ln
- 4120 E Cincinnati Ave
- 4170 E Baltimore Ave
- 1944 Randa Ln
- 2278 Miner Way
- 4055 E New York Ave
- 4214 E Baltimore Ave
- 2627 S Lamb Blvd Unit 209
- 2704 Sierra Grande St
- 2716 Sierra Grande St
- 2710 Sierra Grande St
- 1892 Miner Way
- 2722 Sierra Grande St
- Plan 1998 Modeled at Manzano - Vales
- Plan 1572 at Manzano - Vales
- Plan 1104 at Manzano - Vales
- Plan 2069 at Manzano - Vales
- Plan 1850 at Manzano - Vales
- Plan 1998 at Manzano - Glades
- Plan 2069 Modeled at Manzano - Glades
- 3917 Bolles Harbor St
- 3905 Bolles Harbor St
- 3923 Bolles Harbor St
- 3906 Welter Ave
- 3912 Welter Ave
- 3929 Bolles Harbor St
- 3918 Welter Ave
- 2344 Sag Harbor Dr
- 2314 Sag Harbor Dr
- 2294 Sag Harbor Dr
- 3900 Welter Ave
- 3924 Welter Ave
- 3910 Bolles Harbor St
- 3916 Bolles Harbor St
- 3904 Bolles Harbor St
- 3935 Bolles Harbor St
- 3922 Bolles Harbor St
- 3898 Bolles Harbor St
- 3930 Welter Ave
- 3928 Bolles Harbor St