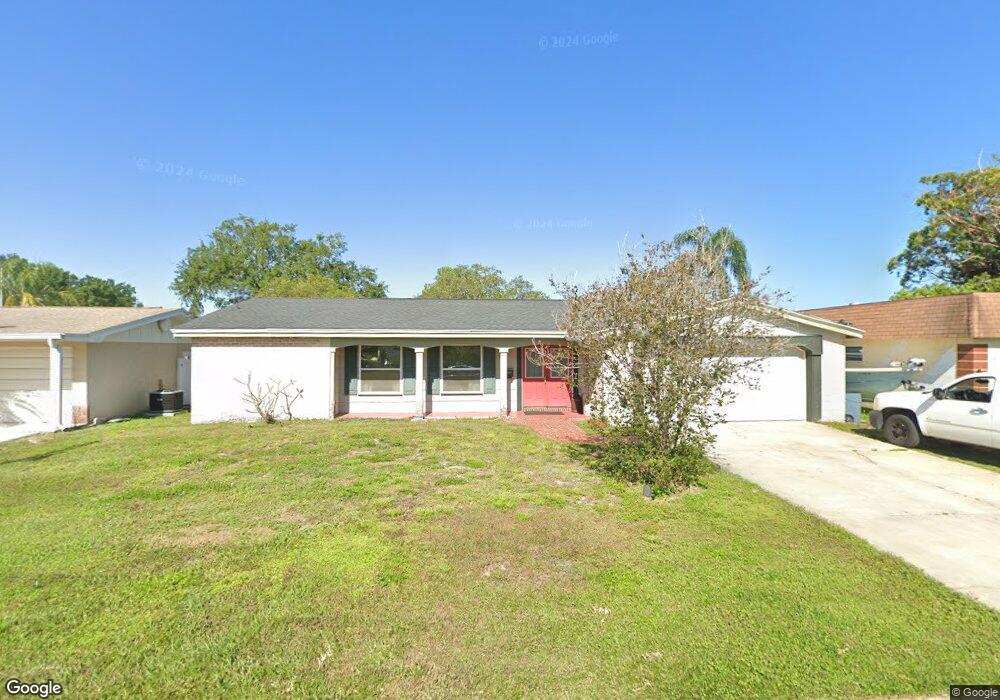
3911 Endicott Dr New Port Richey, FL 34652
Estimated Value: $227,000 - $271,000
3
Beds
2
Baths
1,519
Sq Ft
$162/Sq Ft
Est. Value
About This Home
This home is located at 3911 Endicott Dr, New Port Richey, FL 34652 and is currently estimated at $245,821, approximately $161 per square foot. 3911 Endicott Dr is a home located in Pasco County with nearby schools including Mittye P. Locke Elementary School, Gulf Trace Elementary School, and Paul R. Smith Middle School.
Ownership History
Date
Name
Owned For
Owner Type
Purchase Details
Closed on
Apr 27, 2007
Sold by
Kalagher Rita F
Bought by
Dimarco Robert
Current Estimated Value
Home Financials for this Owner
Home Financials are based on the most recent Mortgage that was taken out on this home.
Original Mortgage
$120,854
Outstanding Balance
$72,870
Interest Rate
6.1%
Mortgage Type
Purchase Money Mortgage
Estimated Equity
$172,951
Purchase Details
Closed on
Jul 30, 1996
Sold by
Jones Jean
Bought by
Kalagher Raymond F and Kalagher Rita F
Home Financials for this Owner
Home Financials are based on the most recent Mortgage that was taken out on this home.
Original Mortgage
$25,000
Interest Rate
8.36%
Mortgage Type
New Conventional
Purchase Details
Closed on
Jun 28, 1995
Sold by
Loreng John A and Loreng Nancy
Bought by
Jones Sharon and Jones Jean
Create a Home Valuation Report for This Property
The Home Valuation Report is an in-depth analysis detailing your home's value as well as a comparison with similar homes in the area
Home Values in the Area
Average Home Value in this Area
Purchase History
| Date | Buyer | Sale Price | Title Company |
|---|---|---|---|
| Dimarco Robert | $122,000 | 1St Affiliated Title Service | |
| Kalagher Raymond F | $66,000 | -- | |
| Jones Jean | $100 | -- | |
| Jones Sharon | $52,900 | -- |
Source: Public Records
Mortgage History
| Date | Status | Borrower | Loan Amount |
|---|---|---|---|
| Open | Dimarco Robert | $120,854 | |
| Previous Owner | Jones Jean | $25,000 |
Source: Public Records
Tax History Compared to Growth
Tax History
| Year | Tax Paid | Tax Assessment Tax Assessment Total Assessment is a certain percentage of the fair market value that is determined by local assessors to be the total taxable value of land and additions on the property. | Land | Improvement |
|---|---|---|---|---|
| 2025 | $706 | $59,530 | -- | -- |
| 2024 | $706 | $57,860 | -- | -- |
| 2023 | $688 | $56,180 | $0 | $0 |
| 2022 | $632 | $54,550 | $0 | $0 |
| 2021 | $624 | $52,970 | $12,936 | $40,034 |
| 2020 | $613 | $52,240 | $11,760 | $40,480 |
| 2019 | $612 | $51,070 | $0 | $0 |
| 2018 | $601 | $50,122 | $0 | $0 |
| 2017 | $593 | $50,122 | $0 | $0 |
| 2016 | $541 | $48,081 | $0 | $0 |
| 2015 | $543 | $47,747 | $0 | $0 |
| 2014 | $520 | $51,647 | $7,938 | $43,709 |
Source: Public Records
Map
Nearby Homes
- 3902 Glissade Dr
- 4209 Stratfield Dr
- 3845 Edgemont Dr
- 4202 Craftsbury Dr
- 4243 Stratfield Dr
- 4111 Stratfield Dr
- 4241 Newbury Dr
- 4150 Woodsville Dr
- 3847 Lighthouse Way
- 4025 Sail Dr
- 4016 Grayton Dr
- 4325 Newbury Dr
- 3862 Lighthouse Way
- 4423 Pelorus Dr Unit B
- 4009 Litchfield Dr
- 4424 Pelorus Dr
- 4015 Litchfield Dr
- 3704 Oakhurst Dr
- 3926 Lighthouse Way Unit A
- 4238 Glissade Dr
- 3903 Endicott Dr
- 3910 Glissade Dr
- 3918 Glissade Dr
- 3925 Endicott Dr
- 3910 Endicott Dr
- 3902 Endicott Dr
- 3918 Endicott Dr
- 3924 Glissade Dr
- 4212 Grayton Dr
- 3924 Endicott Dr
- 4206 Grayton Dr
- 3931 Endicott Dr
- 4220 Grayton Dr
- 4144 Claremont Dr
- 3930 Glissade Dr
- 3911 Ming Tree Dr
- 3903 Ming Tree Dr
- 4145 Grayton Dr
- 4145 Grayton Dr Unit Dr