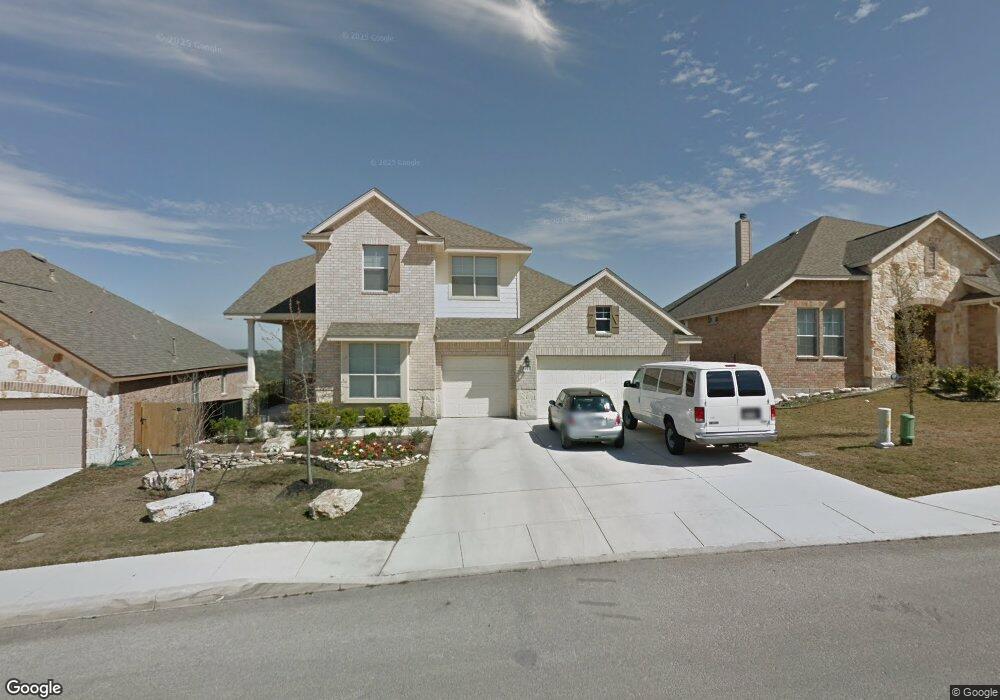
3911 Forsythia San Antonio, TX 78261
Bulverde Village NeighborhoodEstimated Value: $472,000 - $573,000
4
Beds
3
Baths
3,070
Sq Ft
$173/Sq Ft
Est. Value
About This Home
This home is located at 3911 Forsythia, San Antonio, TX 78261 and is currently estimated at $531,900, approximately $173 per square foot. 3911 Forsythia is a home located in Bexar County with nearby schools including Indian Springs Elementary School.
Ownership History
Date
Name
Owned For
Owner Type
Purchase Details
Closed on
May 22, 2015
Sold by
Lee Jung J and Lee Jung Ja
Bought by
Bryan James Bob and Bryan Carmen C
Current Estimated Value
Home Financials for this Owner
Home Financials are based on the most recent Mortgage that was taken out on this home.
Original Mortgage
$330,560
Outstanding Balance
$254,929
Interest Rate
3.71%
Mortgage Type
VA
Estimated Equity
$276,971
Purchase Details
Closed on
Jul 26, 2012
Sold by
Lee Kyung Moon
Bought by
Lee Jung Ja
Purchase Details
Closed on
Dec 28, 2007
Sold by
Standard Pacific Of Texas Inc
Bought by
Lee Kyung M and Lee Jung J
Home Financials for this Owner
Home Financials are based on the most recent Mortgage that was taken out on this home.
Original Mortgage
$285,100
Interest Rate
6.26%
Mortgage Type
Purchase Money Mortgage
Create a Home Valuation Report for This Property
The Home Valuation Report is an in-depth analysis detailing your home's value as well as a comparison with similar homes in the area
Home Values in the Area
Average Home Value in this Area
Purchase History
| Date | Buyer | Sale Price | Title Company |
|---|---|---|---|
| Bryan James Bob | -- | First American Title | |
| Lee Jung Ja | -- | None Available | |
| Lee Kyung M | -- | Fatco-Sa |
Source: Public Records
Mortgage History
| Date | Status | Borrower | Loan Amount |
|---|---|---|---|
| Open | Bryan James Bob | $330,560 | |
| Previous Owner | Lee Kyung M | $285,100 |
Source: Public Records
Tax History Compared to Growth
Tax History
| Year | Tax Paid | Tax Assessment Tax Assessment Total Assessment is a certain percentage of the fair market value that is determined by local assessors to be the total taxable value of land and additions on the property. | Land | Improvement |
|---|---|---|---|---|
| 2025 | $6,667 | $491,202 | $98,730 | $392,472 |
| 2024 | $6,667 | $496,000 | $98,730 | $397,270 |
| 2023 | $6,667 | $473,751 | $98,730 | $452,270 |
| 2022 | $8,980 | $430,683 | $82,350 | $409,780 |
| 2021 | $8,253 | $391,530 | $75,350 | $316,180 |
| 2020 | $8,339 | $389,640 | $75,350 | $314,290 |
| 2019 | $8,581 | $392,660 | $75,350 | $317,310 |
| 2018 | $8,267 | $378,380 | $75,350 | $303,030 |
| 2017 | $7,544 | $344,900 | $75,350 | $269,550 |
| 2016 | $7,376 | $337,220 | $75,350 | $261,870 |
| 2015 | $5,736 | $334,860 | $55,000 | $279,860 |
| 2014 | $5,736 | $308,910 | $0 | $0 |
Source: Public Records
Map
Nearby Homes
- 25815 Plumbago
- 3719 Forsythia
- 3843 Ox-Eye Daisy
- 3818 Sweet Olive
- 25819 Berberis
- 5219 Wolf Bane Dr
- 3722 Sweet Olive
- 3702 Sweet Olive
- 26211 Big Bluestem
- 25706 Coreopsis
- 25703 Berberis
- 3618 Sweet Olive
- 25714 Berberis
- 25707 Preserve Crest
- 3718 Pinyon Pine
- 25615 Coral Vine
- 26011 Red Heron
- 25346 Colt River
- 25514 Thomas Oaks
- 25268 Cambridge Well
- 3915 Forsythia
- 3907 Forsythia
- 3919 Forsythia
- 3903 Forsythia
- 3910 Forsythia
- 3914 Forsythia
- 3827 Forsythia
- 3923 Forsythia
- 3902 Forsythia
- 3918 Forsythia
- 3826 Forsythia
- 3823 Forsythia
- 25922 Kidneywood
- 3927 Forsythia
- 25943 Natal Plum
- 25947 Natal Plum
- 25939 Natal Plum
- 3822 Forsythia
- 3819 Forsythia
- 25918 Kidneywood