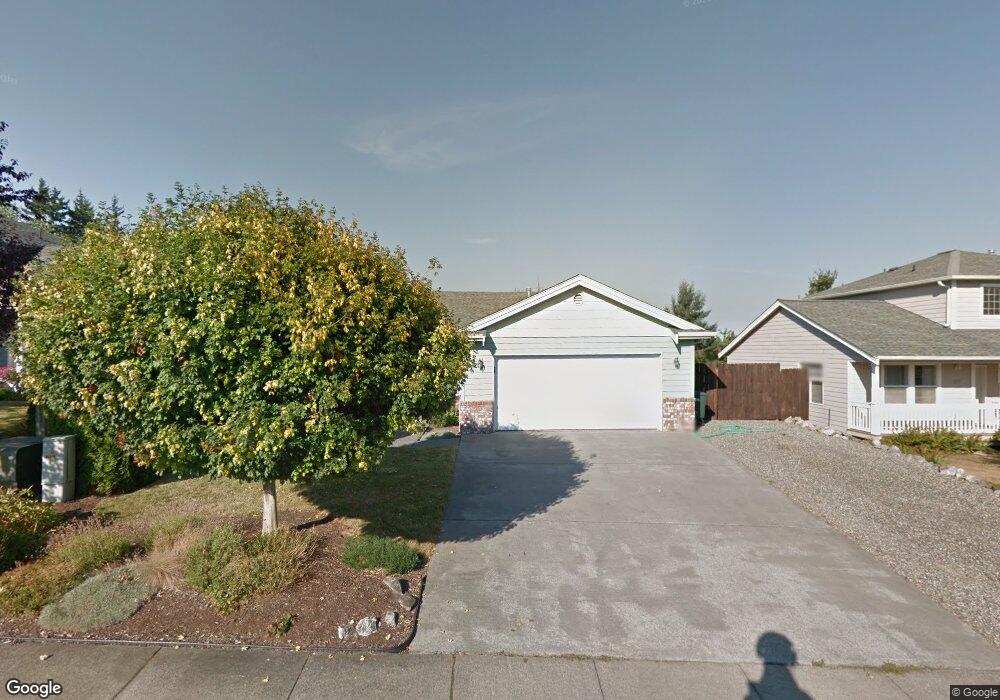
3911 Lakemont Rd Bellingham, WA 98226
Estimated Value: $679,000 - $766,000
3
Beds
2
Baths
1,474
Sq Ft
$480/Sq Ft
Est. Value
About This Home
This home is located at 3911 Lakemont Rd, Bellingham, WA 98226 and is currently estimated at $707,483, approximately $479 per square foot. 3911 Lakemont Rd is a home located in Whatcom County with nearby schools including Northern Heights Elementary School, Shuksan Middle School, and Squalicum High School.
Ownership History
Date
Name
Owned For
Owner Type
Purchase Details
Closed on
Jul 20, 2011
Sold by
Higbee Stephen and Higbee Irene
Bought by
Brigham Stephen P and Brigham Katherine C
Current Estimated Value
Home Financials for this Owner
Home Financials are based on the most recent Mortgage that was taken out on this home.
Original Mortgage
$178,500
Outstanding Balance
$69,214
Interest Rate
4.45%
Mortgage Type
New Conventional
Estimated Equity
$638,269
Create a Home Valuation Report for This Property
The Home Valuation Report is an in-depth analysis detailing your home's value as well as a comparison with similar homes in the area
Home Values in the Area
Average Home Value in this Area
Purchase History
| Date | Buyer | Sale Price | Title Company |
|---|---|---|---|
| Brigham Stephen P | $255,280 | Chicago Title Insurance |
Source: Public Records
Mortgage History
| Date | Status | Borrower | Loan Amount |
|---|---|---|---|
| Open | Brigham Stephen P | $178,500 |
Source: Public Records
Tax History Compared to Growth
Tax History
| Year | Tax Paid | Tax Assessment Tax Assessment Total Assessment is a certain percentage of the fair market value that is determined by local assessors to be the total taxable value of land and additions on the property. | Land | Improvement |
|---|---|---|---|---|
| 2024 | $5,231 | $595,041 | $235,224 | $359,817 |
| 2023 | $5,231 | $621,212 | $245,570 | $375,642 |
| 2022 | $4,147 | $505,050 | $199,650 | $305,400 |
| 2021 | $4,199 | $417,397 | $165,000 | $252,397 |
| 2020 | $4,096 | $397,401 | $132,405 | $264,996 |
| 2019 | $3,647 | $371,294 | $123,803 | $247,491 |
| 2018 | $3,781 | $333,026 | $111,053 | $221,973 |
| 2017 | $3,292 | $294,664 | $98,260 | $196,404 |
| 2016 | $3,041 | $267,791 | $89,420 | $178,371 |
| 2015 | $3,195 | $255,120 | $85,000 | $170,120 |
| 2014 | -- | $260,678 | $103,200 | $157,478 |
| 2013 | -- | $249,944 | $100,000 | $149,944 |
Source: Public Records
Map
Nearby Homes
- 1430 Welling Rd
- 1368 Roma Rd
- 3871 Cindy Ln
- 3785 Greenville Place
- 1379 Northwood Ct
- 1314 Welling Rd
- 1580 Hillsdale Rd
- 4121 Malachite Dr
- 4136 Malachite Dr
- 3827 Keystone Way
- 3606 Tree Farm Ct
- 3715 E Sunset Dr
- 3817 E Sunset Dr
- 1812 Squalicum Mountain Rd
- 3666 Woodlake Rd
- 3713 Bristol St
- 3709 Bristol St
- 1668 Sapphire Trail
- 4055 Springland Ct
- 4220 Brays Way
- 3919 Lakemont Rd
- 3905 Lakemont Rd
- 3923 Lakemont Rd
- 3901 Lakemont Rd
- 3906 Aaron Ct
- 1414 Mcleod Rd
- 3908 Aaron Ct
- 1402 E Mcleod Rd
- 3910 Lakemont Rd
- 1402 Mcleod Rd
- 3904 Lakemont Rd
- 3918 Lakemont Rd
- 1414 E Mcleod Rd
- 3927 Lakemont Rd
- 3912 Aaron Ct
- 3900 Lakemont Rd
- 3926 Lakemont Rd
- 3902 Aaron Ct
- 3916 Aaron Ct
- 3933 Lakemont Rd