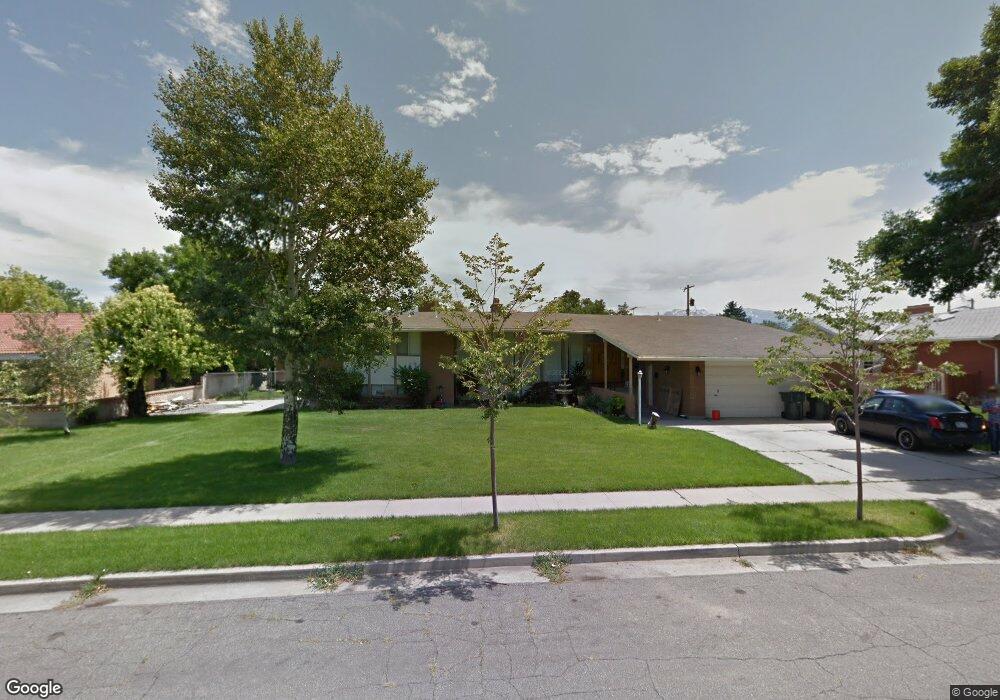
3911 Market St Salt Lake City, UT 84119
Granger NeighborhoodEstimated Value: $549,000 - $649,000
5
Beds
5
Baths
1,920
Sq Ft
$322/Sq Ft
Est. Value
About This Home
This home is located at 3911 Market St, Salt Lake City, UT 84119 and is currently estimated at $617,611, approximately $321 per square foot. 3911 Market St is a home located in Salt Lake County with nearby schools including Rolling Meadows Elementary School, Valley Junior High School, and Granger High School.
Ownership History
Date
Name
Owned For
Owner Type
Purchase Details
Closed on
Oct 3, 2023
Sold by
Nguyen Trieu and Koy Sophan
Bought by
Trieu Nguyen & Sophan Koy Trust and Nguyen
Current Estimated Value
Purchase Details
Closed on
Feb 10, 2021
Sold by
Koy Sophan
Bought by
Koy Sophan and Nguyen Trieu
Home Financials for this Owner
Home Financials are based on the most recent Mortgage that was taken out on this home.
Original Mortgage
$150,000
Interest Rate
2.1%
Mortgage Type
New Conventional
Purchase Details
Closed on
Sep 25, 2012
Sold by
Koy Sopan
Bought by
Koy Sophan and Koy Trieu
Home Financials for this Owner
Home Financials are based on the most recent Mortgage that was taken out on this home.
Original Mortgage
$188,000
Interest Rate
3.55%
Mortgage Type
New Conventional
Purchase Details
Closed on
Sep 24, 2012
Sold by
Williams Randy J and Williams Melanie A
Bought by
Koy Sophan
Home Financials for this Owner
Home Financials are based on the most recent Mortgage that was taken out on this home.
Original Mortgage
$188,000
Interest Rate
3.55%
Mortgage Type
New Conventional
Purchase Details
Closed on
Jul 5, 2000
Sold by
Williams Randy
Bought by
Williams Randy J and Williams Melanie A
Home Financials for this Owner
Home Financials are based on the most recent Mortgage that was taken out on this home.
Original Mortgage
$153,600
Interest Rate
8.63%
Mortgage Type
Balloon
Purchase Details
Closed on
Jun 3, 2000
Sold by
Kimball Esther A
Bought by
Williams Randy
Home Financials for this Owner
Home Financials are based on the most recent Mortgage that was taken out on this home.
Original Mortgage
$153,600
Interest Rate
8.63%
Mortgage Type
Balloon
Purchase Details
Closed on
Jul 3, 1997
Sold by
Kimball Elden C and Kimball Esther A
Bought by
Kimball Esther A
Purchase Details
Closed on
Mar 9, 1995
Sold by
Kimball Elden C and Kimball Esther A
Bought by
Kimball Elden C and Kimball Esther A
Create a Home Valuation Report for This Property
The Home Valuation Report is an in-depth analysis detailing your home's value as well as a comparison with similar homes in the area
Home Values in the Area
Average Home Value in this Area
Purchase History
| Date | Buyer | Sale Price | Title Company |
|---|---|---|---|
| Trieu Nguyen & Sophan Koy Trust | -- | None Listed On Document | |
| Koy Sophan | -- | Meridian Title | |
| Koy Sophan | -- | Meridian Title | |
| Koy Sophan | -- | Inwest Title Services | |
| Koy Sophan | -- | United Title Services | |
| Williams Randy J | -- | First American Title | |
| Williams Randy | -- | First American Title | |
| Kimball Esther A | -- | -- | |
| Kimball Elden C | -- | -- |
Source: Public Records
Mortgage History
| Date | Status | Borrower | Loan Amount |
|---|---|---|---|
| Previous Owner | Koy Sophan | $150,000 | |
| Previous Owner | Koy Sophan | $188,000 | |
| Previous Owner | Williams Randy J | $153,600 |
Source: Public Records
Tax History Compared to Growth
Tax History
| Year | Tax Paid | Tax Assessment Tax Assessment Total Assessment is a certain percentage of the fair market value that is determined by local assessors to be the total taxable value of land and additions on the property. | Land | Improvement |
|---|---|---|---|---|
| 2025 | $3,557 | $582,600 | $158,100 | $424,500 |
| 2024 | $3,557 | $544,900 | $149,900 | $395,000 |
| 2023 | $3,494 | $512,500 | $144,100 | $368,400 |
| 2022 | $3,257 | $479,100 | $141,200 | $337,900 |
| 2021 | $2,974 | $393,100 | $108,700 | $284,400 |
| 2020 | $2,769 | $345,500 | $96,000 | $249,500 |
| 2019 | $2,798 | $336,700 | $90,600 | $246,100 |
| 2018 | $2,640 | $306,100 | $90,600 | $215,500 |
| 2017 | $2,346 | $276,700 | $90,600 | $186,100 |
| 2016 | $2,316 | $273,600 | $90,600 | $183,000 |
| 2015 | $2,119 | $238,400 | $89,700 | $148,700 |
| 2014 | $2,079 | $229,100 | $87,000 | $142,100 |
Source: Public Records
Map
Nearby Homes
- 2845 Marcus Rd S
- 2807 W 3835 S
- 2754 W 3835 S
- 2595 W 3800 S
- 3031 W 3875 S
- 3035 W 3835 S
- 2483 W 3965 S
- 4077 Tralee Cir
- 3018 W 4100 S
- 3903 S 3200 W Unit 2
- 4107 S Greyhackle Ln
- 4111 S Greyhackle Ln
- 3851 S 3200 W Unit 3855
- 4153 S 2700 W Unit 1G
- 4165 S 2700 W Unit 2D
- 4115 S Middlepark Ln Unit 22
- 3917 David Place
- 2409 W Hardrock Dr
- 2451 Hard Rock Cir S
- 4244 S 2835 W
- 3911 S Market St
- 3903 S Market St
- 3903 Market St
- 3919 Market St
- 3920 Lee Maur St
- 3910 Lee Maur St
- 3930 Lee Maur St
- 3900 Lee Maur St
- 3920 S Lee Maur St
- 3910 Market St
- 3900 S Lee Maur St
- 3893 Market St
- 3920 Market St
- 3900 Market St
- 3935 Market St
- 3942 Lee Maur St
- 3892 S Lee Maur St
- 3892 Lee Maur St
- 3895 S Campfire Cir
- 3932 Market St