Estimated Value: $487,380 - $594,000
4
Beds
4
Baths
3,576
Sq Ft
$152/Sq Ft
Est. Value
About This Home
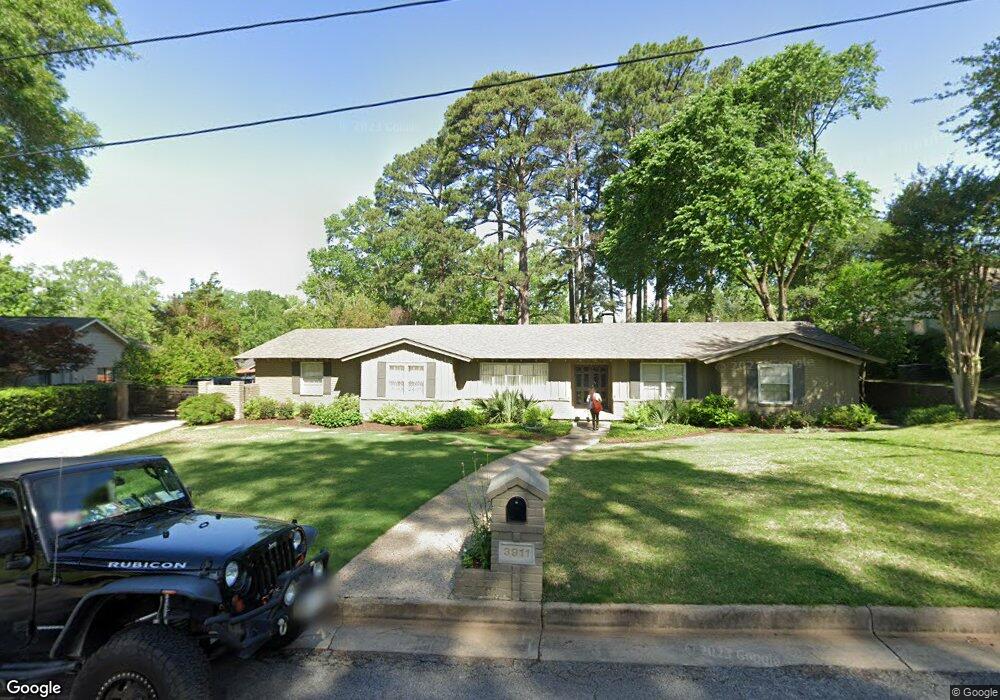
This home is located at 3911 Pinedale Place, Tyler, TX 75701 and is currently estimated at $542,595, approximately $151 per square foot. 3911 Pinedale Place is a home located in Smith County with nearby schools including Woods Elementary School, Hubbard Middle School, and Tyler Legacy High School.
Ownership History
Date
Name
Owned For
Owner Type
Purchase Details
Closed on
Jun 14, 2024
Sold by
Cordell David H and Cordell Tracy L
Bought by
Freeman David Keith and Freeman Holly Jane
Current Estimated Value
Home Financials for this Owner
Home Financials are based on the most recent Mortgage that was taken out on this home.
Original Mortgage
$350,000
Outstanding Balance
$344,970
Interest Rate
6.75%
Mortgage Type
New Conventional
Estimated Equity
$197,625
Purchase Details
Closed on
Feb 23, 2021
Sold by
Dccr Properties Llc
Bought by
Cordell David and Cordell Tracy
Purchase Details
Closed on
Sep 24, 2009
Sold by
Green Kevin D and Green Sandra L
Bought by
Cordell David H and Cordell Tracy L
Home Financials for this Owner
Home Financials are based on the most recent Mortgage that was taken out on this home.
Original Mortgage
$256,000
Interest Rate
5.37%
Mortgage Type
New Conventional
Create a Home Valuation Report for This Property
The Home Valuation Report is an in-depth analysis detailing your home's value as well as a comparison with similar homes in the area
Home Values in the Area
Average Home Value in this Area
Purchase History
| Date | Buyer | Sale Price | Title Company |
|---|---|---|---|
| Freeman David Keith | -- | None Listed On Document | |
| Cordell David | -- | None Available | |
| Cordell David H | -- | East Texas Title Company |
Source: Public Records
Mortgage History
| Date | Status | Borrower | Loan Amount |
|---|---|---|---|
| Open | Freeman David Keith | $350,000 | |
| Previous Owner | Cordell David H | $256,000 |
Source: Public Records
Tax History Compared to Growth
Tax History
| Year | Tax Paid | Tax Assessment Tax Assessment Total Assessment is a certain percentage of the fair market value that is determined by local assessors to be the total taxable value of land and additions on the property. | Land | Improvement |
|---|---|---|---|---|
| 2025 | $7,163 | $485,209 | $50,998 | $434,211 |
| 2024 | $7,163 | $481,418 | $39,218 | $446,421 |
| 2023 | $7,629 | $533,621 | $39,218 | $494,403 |
| 2022 | $7,795 | $397,866 | $33,615 | $364,251 |
| 2021 | $8,256 | $393,529 | $33,615 | $359,914 |
| 2020 | $8,062 | $388,268 | $33,615 | $354,653 |
| 2019 | $7,490 | $342,526 | $22,410 | $320,116 |
| 2018 | $7,236 | $332,702 | $22,410 | $310,292 |
| 2017 | $7,346 | $344,083 | $22,410 | $321,673 |
| 2016 | $7,489 | $350,768 | $22,410 | $328,358 |
| 2015 | $6,544 | $331,271 | $22,410 | $308,861 |
| 2014 | $6,544 | $320,998 | $22,410 | $298,588 |
Source: Public Records
Map
Nearby Homes
- 3710 Bain Place
- 4021 New Copeland Rd
- 3712 Colony Park Dr
- 3511 S Keaton Ave
- 1107 Pinedale Place
- 3523 S Cameron Ave
- 1113 E Amherst Dr
- 4601 Cambridge Dr
- 1505 Glenrose St
- 1408 Westfield St
- 4211 Birdwell Dr
- 1018 Pollard Dr
- 3210 S Donnybrook Ave
- 3202 S Donnybrook Ave
- 1608 Yosemite Dr
- 3400 Birdwell Dr
- 817 Woodhall Ct
- 3235 Curtis Dr
- 1720 Kimwood Ln
- 3215 Curtis Dr
- 3915 Pinedale Place
- 3907 Pinedale Place
- 3904 Fry Ave
- 3904 3904 Fry Ave
- 3838 Fry Ave
- 3912 Fry Ave
- 3914 Pinedale Place
- 3914 3914 Pinedale
- 3832 Fry Ave
- 3832 3832 Ferry
- 3919 Pinedale Place
- 3918 Fry Ave
- 3918 3918 Fry Ave
- 3908 Pinedale Place
- 3918 Pinedale Place
- 3903 Pinedale Place
- 3922 Fry Ave
- 3913 3913 Ferry
- 3826 Fry Ave
- 3905 Fry Ave