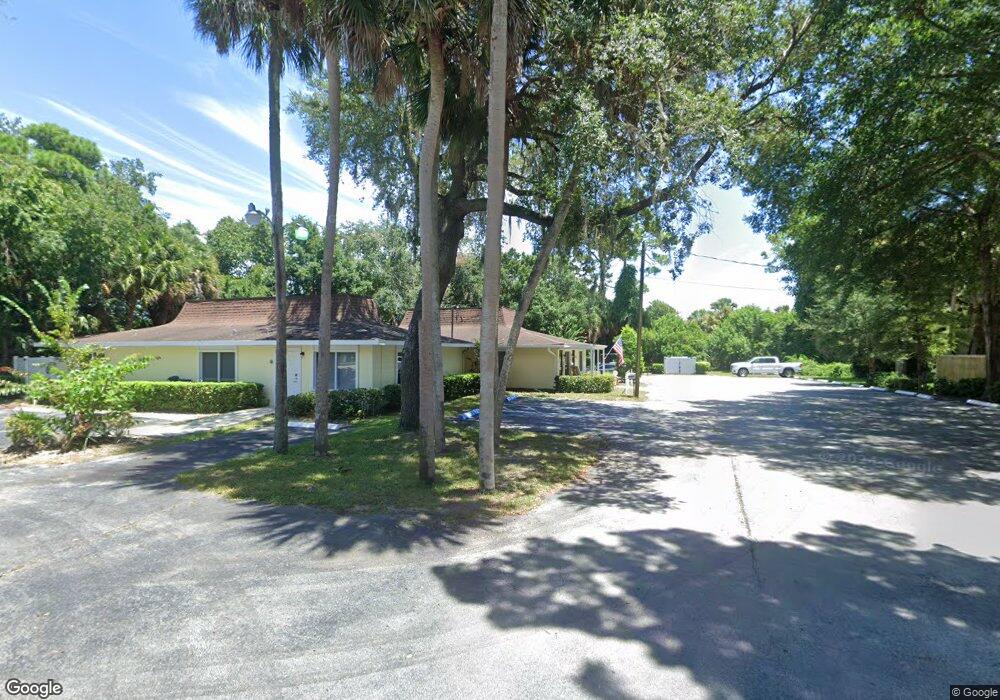
3911 S Nova Rd Port Orange, FL 32127
South Port Orange NeighborhoodEstimated Value: $962,724
--
Bed
7
Baths
4,880
Sq Ft
$197/Sq Ft
Est. Value
About This Home
This home is located at 3911 S Nova Rd, Port Orange, FL 32127 and is currently estimated at $962,724, approximately $197 per square foot. 3911 S Nova Rd is a home located in Volusia County with nearby schools including Sugar Mill Elementary School, Silver Sands Middle School, and Spruce Creek High School.
Ownership History
Date
Name
Owned For
Owner Type
Purchase Details
Closed on
Feb 29, 2016
Sold by
3911 Nova Inc
Bought by
3911 Nova Llc
Current Estimated Value
Home Financials for this Owner
Home Financials are based on the most recent Mortgage that was taken out on this home.
Original Mortgage
$350,000
Outstanding Balance
$278,306
Interest Rate
3.79%
Mortgage Type
Commercial
Estimated Equity
$684,418
Purchase Details
Closed on
Dec 10, 2014
Sold by
Jennings Lane E
Bought by
3911 Nova Inc
Home Financials for this Owner
Home Financials are based on the most recent Mortgage that was taken out on this home.
Original Mortgage
$245,000
Interest Rate
4.02%
Mortgage Type
Seller Take Back
Purchase Details
Closed on
Aug 15, 1982
Bought by
3911 Nova Llc
Purchase Details
Closed on
Sep 15, 1978
Bought by
3911 Nova Llc
Create a Home Valuation Report for This Property
The Home Valuation Report is an in-depth analysis detailing your home's value as well as a comparison with similar homes in the area
Home Values in the Area
Average Home Value in this Area
Purchase History
| Date | Buyer | Sale Price | Title Company |
|---|---|---|---|
| 3911 Nova Llc | -- | None Available | |
| 3911 Nova Inc | $400,000 | Attorney | |
| 3911 Nova Inc | -- | Attorney | |
| 3911 Nova Inc | -- | Attorney | |
| 3911 Nova Inc | -- | Attorney | |
| 3911 Nova Llc | $165,000 | -- | |
| 3911 Nova Llc | $18,000 | -- |
Source: Public Records
Mortgage History
| Date | Status | Borrower | Loan Amount |
|---|---|---|---|
| Open | 3911 Nova Llc | $350,000 | |
| Previous Owner | 3911 Nova Inc | $245,000 |
Source: Public Records
Tax History Compared to Growth
Tax History
| Year | Tax Paid | Tax Assessment Tax Assessment Total Assessment is a certain percentage of the fair market value that is determined by local assessors to be the total taxable value of land and additions on the property. | Land | Improvement |
|---|---|---|---|---|
| 2025 | $9,213 | $494,700 | $267,890 | $226,810 |
| 2024 | $9,213 | $492,692 | $267,890 | $224,802 |
| 2023 | $9,213 | $474,129 | $262,532 | $211,597 |
| 2022 | $8,550 | $439,768 | $254,496 | $185,272 |
| 2021 | $8,704 | $422,333 | $254,496 | $167,837 |
| 2020 | $8,535 | $418,141 | $241,101 | $177,040 |
| 2019 | $8,161 | $401,288 | $241,101 | $160,187 |
| 2018 | $8,254 | $396,788 | $241,101 | $155,687 |
| 2017 | $8,385 | $391,925 | $241,101 | $150,824 |
| 2016 | $7,496 | $338,944 | $0 | $0 |
| 2015 | $7,660 | $333,895 | $0 | $0 |
| 2014 | $6,710 | $284,341 | $0 | $0 |
Source: Public Records
Map
Nearby Homes
- 701 Priscilla Ct
- 3307 Oak Trail Run
- 2910 Oak Trail Run
- 912 Tree Garden Dr
- 3302 Oak Trail Run
- 924 Mill Road Ln
- 723 Raven Rock Ct
- 3960 Willow Trail Run Unit 27
- 3101 Oak Trail Run
- 707 Kristina Ct
- 722 Raven Rock Ct
- 923 Sand Crest Dr
- 4590 Miles Dr
- 940 Village Trail Unit 3-205
- 940 Village Trail Unit 8-206
- 940 Village Trail Unit 6-109
- 940 Village Trail Unit 2-106
- 940 Village Trail Unit 5-106
- 940 Village Trail Unit 6-201
- 940 Village Trail Unit 6-111
- 0 Tbd Nova Rd Unit 2239980
- 703 Tarry Town Trail
- 705 Tarry Town Trail
- 902 Tree Garden Dr
- 3928 S Nova Rd
- 701 Tarry Town Trail
- 707 Tarry Town Trail
- 3930 S Nova Rd
- 904 Tree Garden Dr
- 709 Tarry Town Trail
- 914 Mill Road Ln
- 915 Mill Road Ln
- 704 Tarry Town Trail
- 702 Sleepy Hollow Dr
- 703 Sleepy Hollow Dr
- 711 Tarry Town Trail
- 903 Tree Garden Dr
- 906 Tree Garden Dr
- 917 Mill Road Ln
- 704 Sleepy Hollow Dr