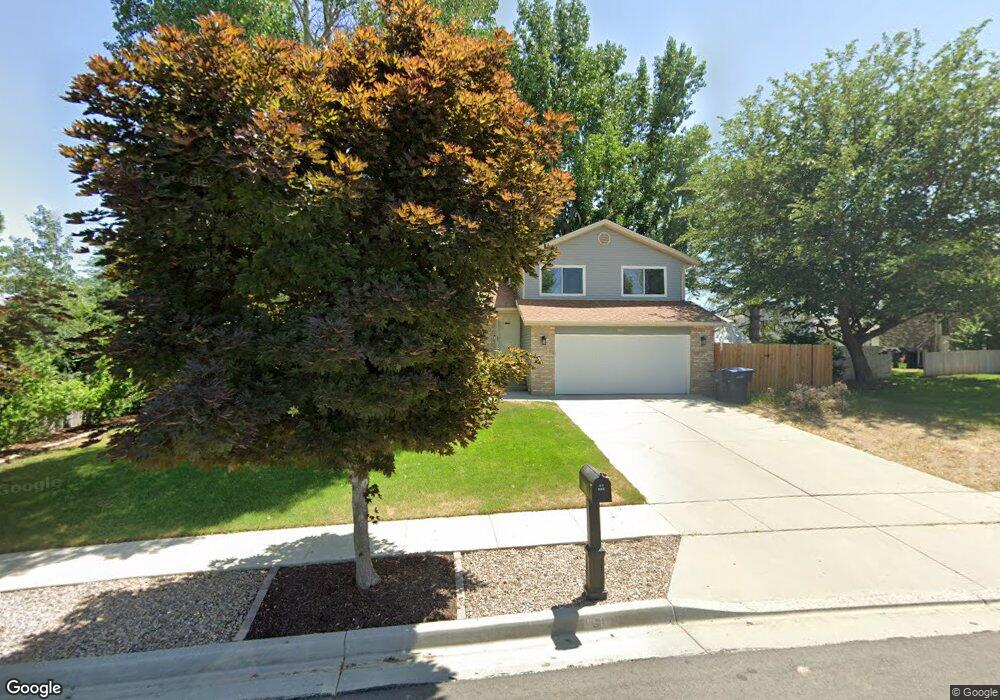
3911 W Dunkeld St South Jordan, UT 84009
Glenmoor Country Estates NeighborhoodEstimated Value: $541,673 - $599,000
4
Beds
2
Baths
2,072
Sq Ft
$277/Sq Ft
Est. Value
About This Home
This home is located at 3911 W Dunkeld St, South Jordan, UT 84009 and is currently estimated at $574,668, approximately $277 per square foot. 3911 W Dunkeld St is a home located in Salt Lake County with nearby schools including Elk Meadows Elementary School, Elk Ridge Middle School, and Mountain West Montessori Academy.
Ownership History
Date
Name
Owned For
Owner Type
Purchase Details
Closed on
Jun 25, 2020
Sold by
Kelsch Tyler B
Bought by
Park Ryan
Current Estimated Value
Home Financials for this Owner
Home Financials are based on the most recent Mortgage that was taken out on this home.
Original Mortgage
$368,404
Outstanding Balance
$327,282
Interest Rate
3.2%
Mortgage Type
FHA
Estimated Equity
$247,386
Purchase Details
Closed on
Jul 13, 2018
Sold by
Anderson Andrew V
Bought by
Kelsch Tyler B
Home Financials for this Owner
Home Financials are based on the most recent Mortgage that was taken out on this home.
Original Mortgage
$315,250
Interest Rate
4.5%
Mortgage Type
New Conventional
Purchase Details
Closed on
Apr 8, 2015
Sold by
Bradshaw John D and Bradshaw Rebecca N
Bought by
Anderson Andrew V
Home Financials for this Owner
Home Financials are based on the most recent Mortgage that was taken out on this home.
Original Mortgage
$234,671
Interest Rate
3.76%
Mortgage Type
FHA
Create a Home Valuation Report for This Property
The Home Valuation Report is an in-depth analysis detailing your home's value as well as a comparison with similar homes in the area
Home Values in the Area
Average Home Value in this Area
Purchase History
| Date | Buyer | Sale Price | Title Company |
|---|---|---|---|
| Park Ryan | -- | First American Title | |
| Kelsch Tyler B | -- | Cottonwood Title | |
| Anderson Andrew V | -- | Advanced Title Slc |
Source: Public Records
Mortgage History
| Date | Status | Borrower | Loan Amount |
|---|---|---|---|
| Open | Park Ryan | $368,404 | |
| Previous Owner | Kelsch Tyler B | $315,250 | |
| Previous Owner | Anderson Andrew V | $234,671 |
Source: Public Records
Tax History Compared to Growth
Tax History
| Year | Tax Paid | Tax Assessment Tax Assessment Total Assessment is a certain percentage of the fair market value that is determined by local assessors to be the total taxable value of land and additions on the property. | Land | Improvement |
|---|---|---|---|---|
| 2025 | $2,611 | $506,400 | $149,200 | $357,200 |
| 2024 | $2,611 | $495,700 | $146,400 | $349,300 |
| 2023 | $2,818 | $504,900 | $142,100 | $362,800 |
| 2022 | $2,867 | $503,400 | $139,300 | $364,100 |
| 2021 | $2,216 | $357,000 | $108,600 | $248,400 |
| 2020 | $2,195 | $331,500 | $108,600 | $222,900 |
| 2019 | $2,149 | $319,000 | $102,400 | $216,600 |
| 2018 | $1,786 | $263,800 | $102,400 | $161,400 |
| 2017 | $1,695 | $245,400 | $102,400 | $143,000 |
| 2016 | $1,704 | $233,700 | $102,400 | $131,300 |
| 2015 | $1,689 | $225,200 | $104,300 | $120,900 |
| 2014 | $1,616 | $211,800 | $99,500 | $112,300 |
Source: Public Records
Map
Nearby Homes
- 3928 W Kilt St
- 9941 Birnam Woods Way
- 4058 W Ascot Downs Dr
- 10164 Birnam Woods Way
- 4072 W Ascot Downs Dr
- Raddison Plan at Eagles Landing
- Wembly Plan at Eagles Landing
- Whitmore Plan at Eagles Landing
- Richmond Plan at Eagles Landing
- Regal Plan at Eagles Landing
- Wesley Plan at Eagles Landing
- 3651 W 10200 S Unit 11
- 10376 S 3970 W
- 4208 W Chestnut View Dr
- 4246 W Ascot Downs Dr
- 10252 S 3570 W
- 7196 Sage Creek Rd
- 10447 S Garden Sage Cir
- 10448 S Sage Vista Way
- 10459 S Sage Wood Way
- 3911 Dunkeld St
- 10102 Birnam Woods Way
- 3925 W Dunkeld St
- 3925 Dunkeld St
- 3916 Kilt St
- 3916 W Kilt St
- 3896 Kilt St
- 3928 Kilt St
- 3884 Kilt St
- 10076 S Birnam Woods Way
- 10076 Birnam Woods Way
- 3924 Dunkeld St
- 3935 W Dunkeld St
- 3935 Dunkeld St
- 3940 W Kilt St
- 3940 Kilt St
- 10097 Birnam Woods Way
- 10097 S Birnam Woods Way
- 3936 W Dunkeld St
- 10085 Birnam Woods Way