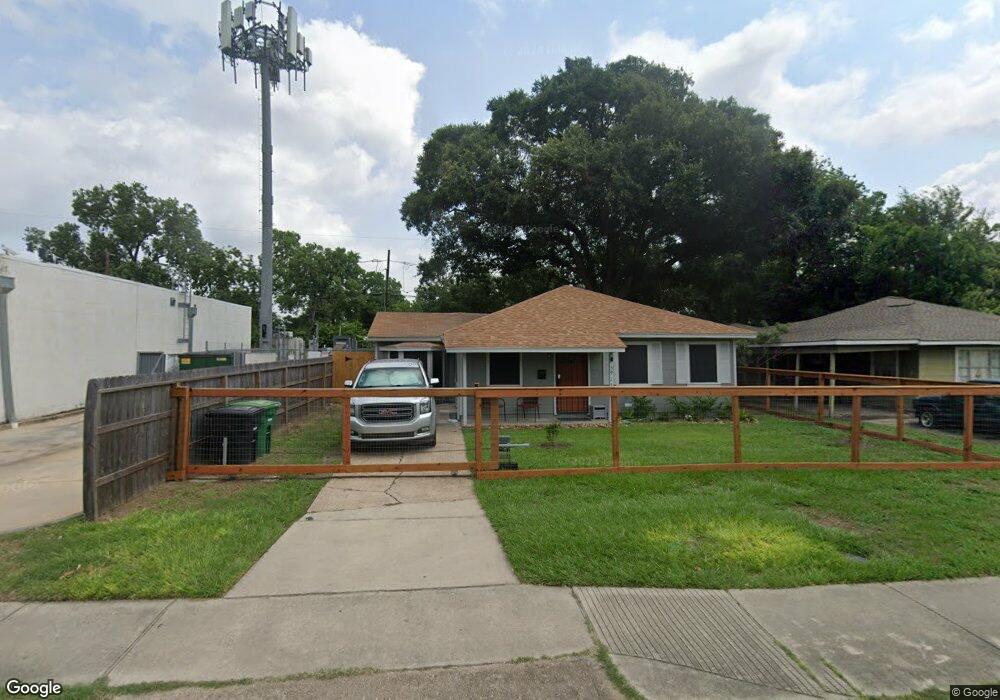
3911 Yellowstone Blvd Houston, TX 77021
OST-South Union NeighborhoodEstimated Value: $141,000 - $179,000
3
Beds
1
Bath
1,166
Sq Ft
$132/Sq Ft
Est. Value
About This Home
This home is located at 3911 Yellowstone Blvd, Houston, TX 77021 and is currently estimated at $154,364, approximately $132 per square foot. 3911 Yellowstone Blvd is a home located in Harris County with nearby schools including Marcellus Elliot Foster Elementary, Cullen Middle School, and Yates High School.
Ownership History
Date
Name
Owned For
Owner Type
Purchase Details
Closed on
Feb 9, 2021
Sold by
S O Dangerfield And Sons Inc
Bought by
Douglas Tina
Current Estimated Value
Home Financials for this Owner
Home Financials are based on the most recent Mortgage that was taken out on this home.
Original Mortgage
$84,960
Outstanding Balance
$75,855
Interest Rate
2.6%
Mortgage Type
New Conventional
Estimated Equity
$78,509
Purchase Details
Closed on
Apr 27, 2011
Sold by
Fannie Mae
Bought by
S O Dangerfield & Sons Inc
Purchase Details
Closed on
Nov 2, 2010
Sold by
Tyler Nathan and Tyler Octavia
Bought by
Federal National Mortgage Association
Purchase Details
Closed on
Oct 3, 2001
Sold by
Nathan Tyler and Redmond Octavia
Bought by
Quartman Tammy
Purchase Details
Closed on
Jan 13, 1998
Sold by
Kashani Ahmad
Bought by
Tyler Natham and Tyler Octavia
Home Financials for this Owner
Home Financials are based on the most recent Mortgage that was taken out on this home.
Original Mortgage
$36,950
Interest Rate
7.13%
Create a Home Valuation Report for This Property
The Home Valuation Report is an in-depth analysis detailing your home's value as well as a comparison with similar homes in the area
Home Values in the Area
Average Home Value in this Area
Purchase History
| Date | Buyer | Sale Price | Title Company |
|---|---|---|---|
| Douglas Tina | -- | None Available | |
| S O Dangerfield & Sons Inc | -- | Old Republic National Title | |
| Federal National Mortgage Association | $40,667 | None Available | |
| Quartman Tammy | -- | -- | |
| Tyler Natham | -- | Regency Title |
Source: Public Records
Mortgage History
| Date | Status | Borrower | Loan Amount |
|---|---|---|---|
| Open | Douglas Tina | $84,960 | |
| Previous Owner | Tyler Natham | $36,950 |
Source: Public Records
Tax History Compared to Growth
Tax History
| Year | Tax Paid | Tax Assessment Tax Assessment Total Assessment is a certain percentage of the fair market value that is determined by local assessors to be the total taxable value of land and additions on the property. | Land | Improvement |
|---|---|---|---|---|
| 2025 | $2,942 | $122,050 | $94,500 | $27,550 |
| 2024 | $2,942 | $140,629 | $94,500 | $46,129 |
| 2023 | $2,942 | $132,637 | $94,500 | $38,137 |
| 2022 | $2,670 | $121,274 | $73,500 | $47,774 |
| 2021 | $2,218 | $95,170 | $47,250 | $47,920 |
| 2020 | $1,847 | $76,277 | $31,500 | $44,777 |
| 2019 | $1,385 | $65,276 | $26,250 | $39,026 |
| 2018 | $886 | $35,000 | $21,000 | $14,000 |
| 2017 | $885 | $35,000 | $21,000 | $14,000 |
| 2016 | $1,049 | $41,505 | $21,000 | $20,505 |
| 2015 | $617 | $31,875 | $21,000 | $10,875 |
| 2014 | $617 | $24,000 | $13,125 | $10,875 |
Source: Public Records
Map
Nearby Homes
- 0 Scott St
- 3930 Daphne St
- 6818 Saint Augustine St
- 6715 Saint Augustine St
- 4011 Ward St
- 6721 Saint Augustine St
- 4013 Ward St
- 4405 Ward St
- 4510 Ward St
- 4508 Ward St
- 4616 Ward St
- 6717 Saint Augustine St
- 6725 Saint Augustine St
- 4015 Ward St
- 6719 Saint Augustine St
- 4017 Ward St
- 4019 Ward St
- 3731 Alberta St
- 6701 Conley St
- 4110 Ward St
- 3917 Yellowstone Blvd
- 15030 Yellowstone Blvd
- 3921 Yellowstone Blvd
- 3925 Yellowstone Blvd
- 3910 Alberta St
- 3906 Alberta St
- 6706 Driftwood St
- 3918 Alberta St
- 3929 Yellowstone Blvd
- 3902 Alberta St
- 3922 Alberta St
- 6705 Scott St
- 6710 Driftwood St
- 3933 Yellowstone Blvd
- 3926 Alberta St
- 6709 Scott St
- 6714 Driftwood St
- 3839 Yellowstone Blvd
- 3937 Yellowstone Blvd
- 6713 Scott St