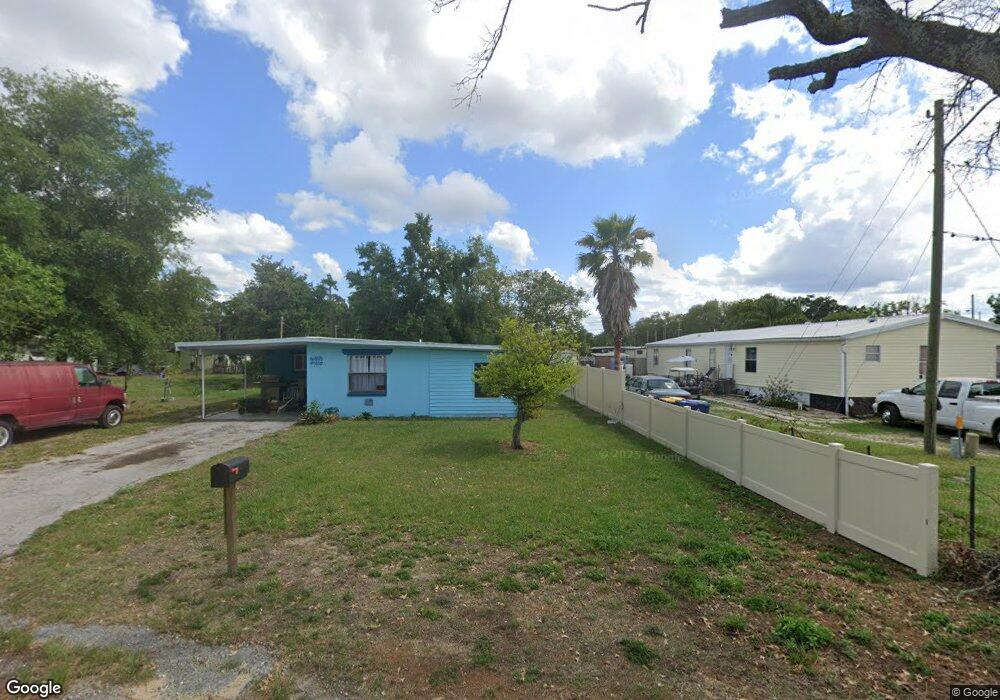
39112 Kendell Dr Zephyrhills, FL 33542
Estimated Value: $120,066 - $198,000
2
Beds
1
Bath
906
Sq Ft
$184/Sq Ft
Est. Value
About This Home
This home is located at 39112 Kendell Dr, Zephyrhills, FL 33542 and is currently estimated at $166,767, approximately $184 per square foot. 39112 Kendell Dr is a home located in Pasco County with nearby schools including Woodland Elementary School, Raymond B. Stewart Middle School, and Zephyrhills High School.
Ownership History
Date
Name
Owned For
Owner Type
Purchase Details
Closed on
Nov 16, 2000
Sold by
Mcneil Charles E and Mcneil Ann
Bought by
Ellor Richard E and Ellor Earlene
Current Estimated Value
Home Financials for this Owner
Home Financials are based on the most recent Mortgage that was taken out on this home.
Original Mortgage
$16,250
Outstanding Balance
$5,966
Interest Rate
7.83%
Mortgage Type
Purchase Money Mortgage
Estimated Equity
$160,801
Purchase Details
Closed on
Feb 5, 1999
Sold by
Conklin Janet A
Bought by
Mcneil Charles E and Mcneil Ann M
Home Financials for this Owner
Home Financials are based on the most recent Mortgage that was taken out on this home.
Original Mortgage
$35,000
Interest Rate
6.8%
Mortgage Type
Purchase Money Mortgage
Purchase Details
Closed on
Dec 4, 1993
Sold by
Knopp Glen E and Knopp Irene M
Bought by
Conklin Robert J and Conklin Janet A
Create a Home Valuation Report for This Property
The Home Valuation Report is an in-depth analysis detailing your home's value as well as a comparison with similar homes in the area
Home Values in the Area
Average Home Value in this Area
Purchase History
| Date | Buyer | Sale Price | Title Company |
|---|---|---|---|
| Ellor Richard E | $65,000 | -- | |
| Mcneil Charles E | $40,000 | -- | |
| Conklin Robert J | $31,000 | -- |
Source: Public Records
Mortgage History
| Date | Status | Borrower | Loan Amount |
|---|---|---|---|
| Open | Mcneil Charles E | $16,250 | |
| Previous Owner | Mcneil Charles E | $35,000 |
Source: Public Records
Tax History Compared to Growth
Tax History
| Year | Tax Paid | Tax Assessment Tax Assessment Total Assessment is a certain percentage of the fair market value that is determined by local assessors to be the total taxable value of land and additions on the property. | Land | Improvement |
|---|---|---|---|---|
| 2025 | $1,185 | $74,825 | $27,493 | $47,332 |
| 2024 | $1,185 | $58,539 | $20,826 | $37,713 |
| 2023 | $1,082 | $52,480 | $0 | $0 |
| 2022 | $937 | $47,710 | $12,696 | $35,014 |
| 2021 | $868 | $43,083 | $11,418 | $31,665 |
| 2020 | $852 | $42,477 | $11,418 | $31,059 |
| 2019 | $841 | $42,958 | $11,418 | $31,540 |
| 2018 | $795 | $42,102 | $11,418 | $30,684 |
| 2017 | $721 | $33,991 | $10,139 | $23,852 |
| 2016 | $680 | $33,474 | $10,139 | $23,335 |
| 2015 | $676 | $32,571 | $10,139 | $22,432 |
| 2014 | $662 | $32,878 | $10,139 | $22,739 |
Source: Public Records
Map
Nearby Homes
- 39019 Heath Dr
- 6308 20th St
- 39132 County Road 54 Unit 2216
- 39132 County Road 54 Unit 2054
- 39132 County Road 54 Unit 2060
- 39153 Hillcrest Dr
- 39093 Citadel Cir
- 6349 20th St
- 6252 Friendship Ln
- 6323 Ohio St
- 6443 Midland St
- 6250 Connecticut St
- 6240 Connecticut St
- 39140 Orient Ave
- 6423 Ohio St
- 6039 20th St
- 6315 Connecticut St
- 39032 Ola Ave
- 39334 Maher Dr
- 6307 Wealthy Ln
- 39118 Kendell Dr Unit I
- 39107 Hillcrest Dr
- 39100 Kirkland Dr
- 39125 Hillcrest Dr
- 39126 Kendell Dr
- 39113 Kendell Dr
- 39108 Hillcrest Dr
- 39050 Kirkland Dr
- 39133 Hillcrest Dr
- 39119 Kendell Dr
- 39101 Kirkland Dr
- 39134 Kendell Dr
- 39127 Kendell Dr Unit 1
- 39042 Kirkland Dr
- 39117 Heath Dr
- 39134 Hillcrest Dr
- 39105 Heath Dr
- 39143 Hillcrest Dr
- 39135 Kendell Dr