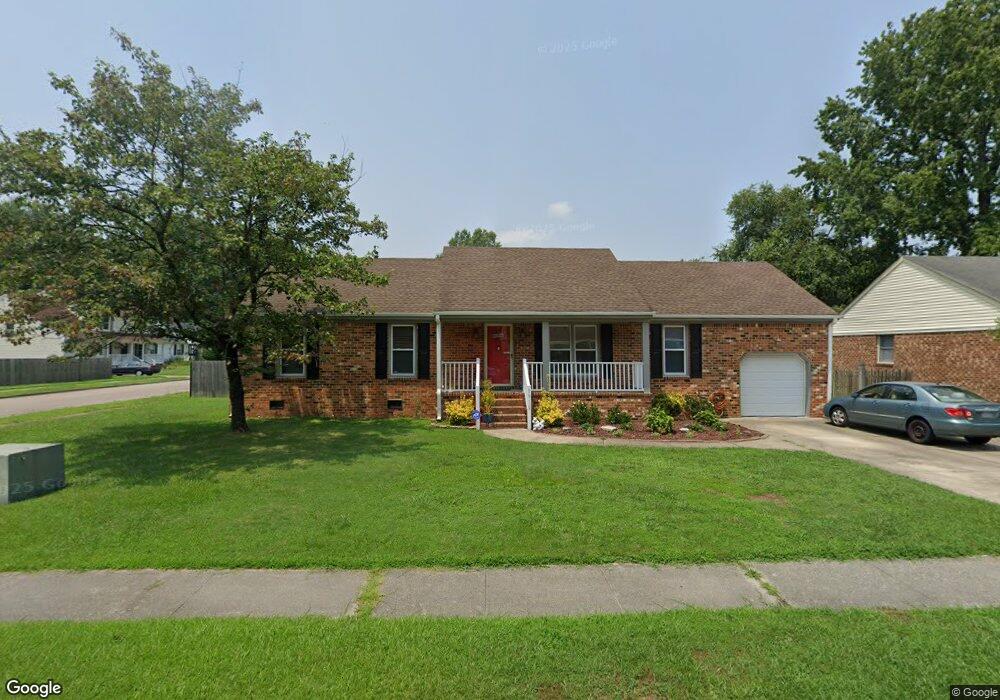
3912 Hardwood Ln Portsmouth, VA 23703
Churchland NeighborhoodEstimated Value: $341,439 - $374,000
3
Beds
2
Baths
1,693
Sq Ft
$213/Sq Ft
Est. Value
About This Home
This home is located at 3912 Hardwood Ln, Portsmouth, VA 23703 and is currently estimated at $359,860, approximately $212 per square foot. 3912 Hardwood Ln is a home located in Portsmouth City with nearby schools including Churchland Primary/Intermediate School, Churchland Middle School, and Churchland High School.
Ownership History
Date
Name
Owned For
Owner Type
Purchase Details
Closed on
Sep 20, 2012
Sold by
Hardin Bruce
Bought by
Heffner Barry K
Current Estimated Value
Home Financials for this Owner
Home Financials are based on the most recent Mortgage that was taken out on this home.
Original Mortgage
$189,050
Outstanding Balance
$130,657
Interest Rate
3.62%
Mortgage Type
New Conventional
Estimated Equity
$229,203
Purchase Details
Closed on
Jul 15, 2004
Sold by
Edmond Charles G
Bought by
Hardin Bruce
Home Financials for this Owner
Home Financials are based on the most recent Mortgage that was taken out on this home.
Original Mortgage
$175,000
Interest Rate
6.2%
Mortgage Type
New Conventional
Purchase Details
Closed on
May 23, 2003
Sold by
Hurley Daniel
Bought by
Emmond Charles
Home Financials for this Owner
Home Financials are based on the most recent Mortgage that was taken out on this home.
Original Mortgage
$21,900
Interest Rate
5.86%
Mortgage Type
Construction
Create a Home Valuation Report for This Property
The Home Valuation Report is an in-depth analysis detailing your home's value as well as a comparison with similar homes in the area
Home Values in the Area
Average Home Value in this Area
Purchase History
| Date | Buyer | Sale Price | Title Company |
|---|---|---|---|
| Heffner Barry K | $199,000 | -- | |
| Hardin Bruce | $175,000 | -- | |
| Emmond Charles | $146,500 | -- |
Source: Public Records
Mortgage History
| Date | Status | Borrower | Loan Amount |
|---|---|---|---|
| Open | Heffner Barry K | $189,050 | |
| Previous Owner | Hardin Bruce | $175,000 | |
| Previous Owner | Emmond Charles | $21,900 |
Source: Public Records
Tax History Compared to Growth
Tax History
| Year | Tax Paid | Tax Assessment Tax Assessment Total Assessment is a certain percentage of the fair market value that is determined by local assessors to be the total taxable value of land and additions on the property. | Land | Improvement |
|---|---|---|---|---|
| 2025 | $4,073 | $325,900 | $78,000 | $247,900 |
| 2024 | $4,073 | $317,250 | $78,000 | $239,250 |
| 2023 | $3,706 | $296,480 | $78,000 | $218,480 |
| 2022 | $3,393 | $260,990 | $65,000 | $195,990 |
| 2021 | $3,117 | $239,750 | $52,420 | $187,330 |
| 2020 | $3,039 | $233,790 | $49,920 | $183,870 |
| 2019 | $2,927 | $225,140 | $49,920 | $175,220 |
| 2018 | $2,927 | $225,140 | $49,920 | $175,220 |
| 2017 | $2,927 | $225,140 | $49,920 | $175,220 |
| 2016 | $2,927 | $225,140 | $49,920 | $175,220 |
| 2015 | $2,920 | $224,610 | $49,920 | $174,690 |
| 2014 | $2,853 | $224,610 | $49,920 | $174,690 |
Source: Public Records
Map
Nearby Homes
- 3433 Willow Breeze Dr
- 5807 Dunkin St
- 5806 Fawkes St
- 3616 Bowden St
- 4100 Mayfair Way
- 3860 Sugar Creek Cir
- 3604 Lilac Dr
- 6015 Arthur Ave
- 3866 Augustine Cir
- 3660B Towne Point Rd Unit A
- 5911 Dunkirk St
- 4200 Quince Rd
- 4028 Swannanoa Dr
- 6002 Campbell St
- 3604 Pierce St
- 4008 Oakhurst Rd
- 6205 Dunkirk St
- 3818 Peach Orchard Cir
- 3877 Peachtree Ln W
- 4224 Burnham Dr
- 2 Hardwood Ct
- 3920 Hardwood Ln
- 4 Hardwood Ct
- 3904 Hardwood Ln
- 3917 Hardwood Ln
- 3913 Hardwood Ln
- 3921 Hardwood Ln
- 3909 Hardwood Ln
- 1 Hardwood Ct
- 6 Hardwood Ct
- 3 Hardwood Ct
- 3925 Hardwood Ln
- 3905 Hardwood Ln
- 5 Hardwood Ct
- 5517 Greenbrook Dr
- 5521 Greenbrook Dr
- 3 Wyngate Ct
- 5525 Greenbrook Dr
- 7 Hardwood Ct
- 3928 Hardwood Ln