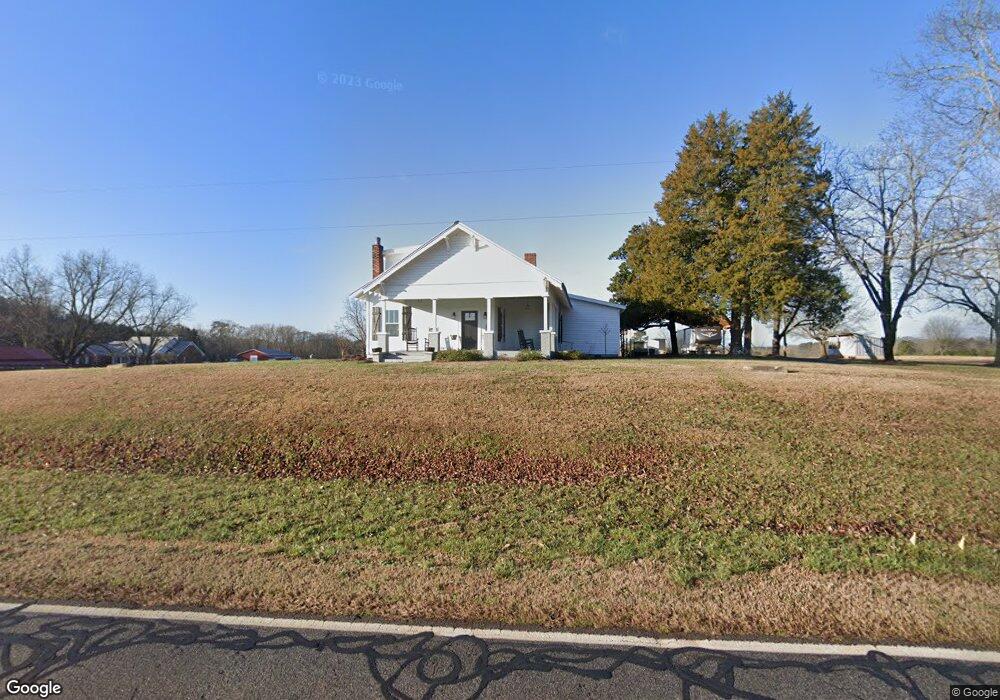
3912 Jacks Creek Rd NW Monroe, GA 30655
Estimated Value: $382,000 - $598,490
--
Bed
--
Bath
1,729
Sq Ft
$271/Sq Ft
Est. Value
About This Home
This home is located at 3912 Jacks Creek Rd NW, Monroe, GA 30655 and is currently estimated at $468,873, approximately $271 per square foot. 3912 Jacks Creek Rd NW is a home located in Walton County with nearby schools including Monroe Elementary School, Carver Middle School, and Monroe Area High School.
Ownership History
Date
Name
Owned For
Owner Type
Purchase Details
Closed on
Oct 26, 2017
Sold by
Gryder Donahue Darla
Bought by
Henson Chelsea S
Current Estimated Value
Purchase Details
Closed on
Jun 28, 2017
Sold by
Gryder Sarah Robison
Bought by
Gryder Donahue Darla
Purchase Details
Closed on
Jun 28, 2012
Sold by
Brand Dorothy Robison
Bought by
Donahue Troy
Purchase Details
Closed on
Feb 28, 2012
Sold by
Matthews James A
Bought by
Brand Dorothy Robison and Gryder Sarah Robison
Purchase Details
Closed on
Oct 30, 2008
Sold by
Brand Dorothy R
Bought by
Matthews James A and Matthews Kathy E
Home Financials for this Owner
Home Financials are based on the most recent Mortgage that was taken out on this home.
Original Mortgage
$35,000
Interest Rate
5.78%
Mortgage Type
Trade
Create a Home Valuation Report for This Property
The Home Valuation Report is an in-depth analysis detailing your home's value as well as a comparison with similar homes in the area
Home Values in the Area
Average Home Value in this Area
Purchase History
| Date | Buyer | Sale Price | Title Company |
|---|---|---|---|
| Henson Chelsea S | $40,000 | -- | |
| Gryder Donahue Darla | -- | -- | |
| Donahue Troy | $10,000 | -- | |
| Donahue Troy | $17,500 | -- | |
| Brand Dorothy Robison | -- | -- | |
| Brand Dorothy Robison | -- | -- | |
| Matthews James A | $32,000 | -- | |
| Gryder Sarah R | -- | -- | |
| Brand Dorothy R | -- | -- |
Source: Public Records
Mortgage History
| Date | Status | Borrower | Loan Amount |
|---|---|---|---|
| Previous Owner | Brand Dorothy R | $35,000 | |
| Previous Owner | Brand Dorothy R | $32,000 |
Source: Public Records
Tax History Compared to Growth
Tax History
| Year | Tax Paid | Tax Assessment Tax Assessment Total Assessment is a certain percentage of the fair market value that is determined by local assessors to be the total taxable value of land and additions on the property. | Land | Improvement |
|---|---|---|---|---|
| 2024 | $3,020 | $192,000 | $109,800 | $82,200 |
| 2023 | $2,878 | $179,560 | $104,160 | $75,400 |
| 2022 | $2,696 | $164,080 | $97,520 | $66,560 |
| 2021 | $619 | $78,000 | $75,800 | $2,200 |
| 2020 | $601 | $68,000 | $65,800 | $2,200 |
| 2019 | $574 | $60,680 | $58,480 | $2,200 |
| 2018 | $564 | $60,680 | $58,480 | $2,200 |
| 2017 | $1,373 | $39,840 | $18,760 | $21,080 |
| 2016 | $1,141 | $33,600 | $14,640 | $18,960 |
| 2015 | $1,129 | $32,720 | $14,640 | $18,080 |
| 2014 | $1,144 | $32,320 | $0 | $0 |
Source: Public Records
Map
Nearby Homes
- 233 Jim Daws Rd
- 345 Mccall Way
- 424 Springtime Way
- 270 Springtime Way
- 1145 Thurston Snow Rd
- 1650 & 1620 Locklin Cemetery Rd
- 1650 Locklin Cemetery Rd
- 430 Laura Dr
- 3166 Old Good Hope Rd
- 1286 Bearden Rd
- 2591 Bearden Blvd
- 0000 Bearden Rd
- 0 Bearden Rd
- 1299 McLeod Estates Dr
- 5555 Georgia 186
- 205 Highway 186 Unit TRACT 1
- 205 Highway 186
- 3279 Tommy Dillard Rd
- 782 Michael Rd
- 1186 Emmas Path
- 3861 Jacks Creek Rd NW
- 3907 Jacks Creek Rd NW
- 3917 Jacks Creek Rd NW
- 2101 Trace Dr Unit LOT 1
- 2101 Trace Dr Unit 1
- 2101 Trace Dr
- 0 Trace Dr Unit 7575314
- 0 Trace Dr Unit 7575244
- 0 Trace Dr
- 2105 Trace Dr Unit 2
- 2105 Trace Dr Unit LOT 2
- 2105 Trace Dr
- 364 Mccall Way
- 331 Mccall Way
- 371 Mccall Way
- 258 Mccall Way
- 246 Mccall Way
- 388 Mccall Way
- 308 Mccall Way
- 223 Mccall Way