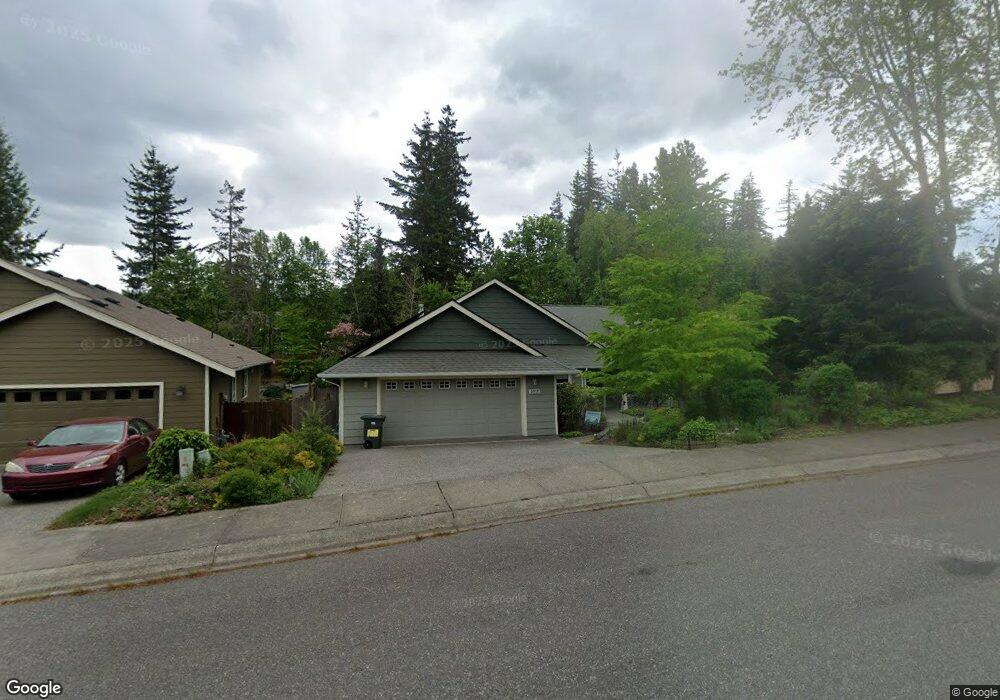
3912 Northridge Way Bellingham, WA 98226
Silver Beach NeighborhoodEstimated Value: $735,000 - $857,000
3
Beds
2
Baths
1,820
Sq Ft
$430/Sq Ft
Est. Value
About This Home
This home is located at 3912 Northridge Way, Bellingham, WA 98226 and is currently estimated at $781,951, approximately $429 per square foot. 3912 Northridge Way is a home located in Whatcom County with nearby schools including Silver Beach Elementary School, Whatcom Middle School, and Squalicum High School.
Ownership History
Date
Name
Owned For
Owner Type
Purchase Details
Closed on
Jan 23, 2006
Sold by
Miller Jessie M
Bought by
Spinks Sarah E
Current Estimated Value
Home Financials for this Owner
Home Financials are based on the most recent Mortgage that was taken out on this home.
Original Mortgage
$162,500
Outstanding Balance
$91,391
Interest Rate
6.28%
Mortgage Type
Fannie Mae Freddie Mac
Estimated Equity
$690,560
Purchase Details
Closed on
May 24, 2002
Sold by
Kashiwa Corey B and Kashiwa Robyn A
Bought by
Miller Jessie M
Home Financials for this Owner
Home Financials are based on the most recent Mortgage that was taken out on this home.
Original Mortgage
$170,800
Interest Rate
6.89%
Purchase Details
Closed on
May 16, 2000
Sold by
Eide Construction Inc
Bought by
Kashiwa Corey B and Kashiwa Robyn A
Home Financials for this Owner
Home Financials are based on the most recent Mortgage that was taken out on this home.
Original Mortgage
$183,350
Interest Rate
7.6%
Create a Home Valuation Report for This Property
The Home Valuation Report is an in-depth analysis detailing your home's value as well as a comparison with similar homes in the area
Home Values in the Area
Average Home Value in this Area
Purchase History
| Date | Buyer | Sale Price | Title Company |
|---|---|---|---|
| Spinks Sarah E | $325,280 | Whatcom Land Title | |
| Miller Jessie M | $213,500 | Stewart Title | |
| Kashiwa Corey B | $193,000 | First American Title Ins Co |
Source: Public Records
Mortgage History
| Date | Status | Borrower | Loan Amount |
|---|---|---|---|
| Open | Spinks Sarah E | $162,500 | |
| Previous Owner | Miller Jessie M | $170,800 | |
| Previous Owner | Kashiwa Corey B | $183,350 |
Source: Public Records
Tax History Compared to Growth
Tax History
| Year | Tax Paid | Tax Assessment Tax Assessment Total Assessment is a certain percentage of the fair market value that is determined by local assessors to be the total taxable value of land and additions on the property. | Land | Improvement |
|---|---|---|---|---|
| 2024 | $5,121 | $630,306 | $218,015 | $412,291 |
| 2023 | $5,121 | $658,021 | $227,601 | $430,420 |
| 2022 | $4,431 | $577,211 | $199,650 | $377,561 |
| 2021 | $4,548 | $477,034 | $165,000 | $312,034 |
| 2020 | $4,396 | $462,063 | $152,655 | $309,408 |
| 2019 | $3,932 | $431,705 | $142,737 | $288,968 |
| 2018 | $4,070 | $387,211 | $128,037 | $259,174 |
| 2017 | $3,539 | $342,607 | $113,288 | $229,319 |
| 2016 | $3,238 | $311,361 | $103,096 | $208,265 |
| 2015 | $3,415 | $296,631 | $98,000 | $198,631 |
| 2014 | -- | $302,653 | $98,040 | $204,613 |
| 2013 | -- | $289,823 | $95,000 | $194,823 |
Source: Public Records
Map
Nearby Homes
- 4055 Springland Ct
- 1379 Northwood Ct
- 4020 Academy St
- 4414 Alice St
- 4431 Alice St
- 3159 Chandler Pkwy
- 3153 Chandler Pkwy
- 3155 Chandler Pkwy
- 3785 Greenville Place
- 3852 Del Bonita Way
- 1314 Welling Rd
- 3527 Sussex Dr
- 3666 Woodlake Rd
- 1430 Welling Rd
- 1580 Hillsdale Rd
- 3709 Bristol St
- 3713 Bristol St
- 2612 Birch St
- 3871 Cindy Ln
- 3826 Gala Loop
- 3908 Northridge Way
- 3916 Northridge Way
- 3920 Northridge Way
- 3606 Westridge Place
- 3602 Westridge Place
- 3907 Springland Ln
- 3911 Northridge Way
- 3915 Springland Ln
- 3921 Springland Ln
- 3907 Northridge Way
- 3903 Springland Ln
- 3924 Northridge Way
- 3616 Westridge Place
- 4005 Springland Ln
- 3619 Northridge Place
- 3900 Springland Ln
- 4007 Springland Ln
- 4004 Northridge Way
- 3618 Northridge Place