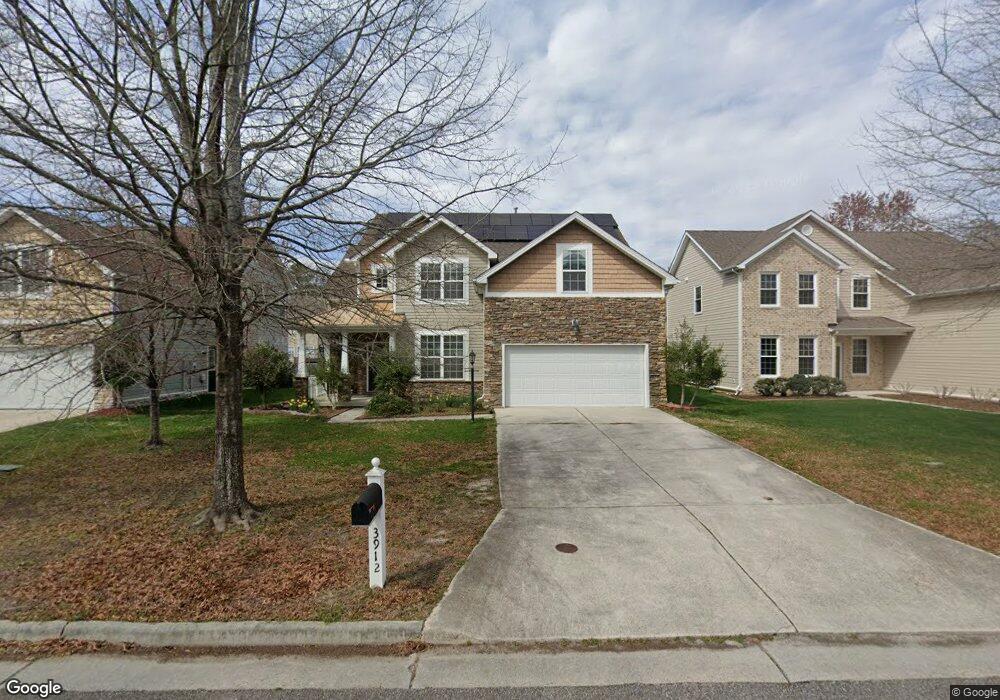
3912 Orchard Spring Way Virginia Beach, VA 23456
Estimated Value: $563,499 - $604,000
4
Beds
3
Baths
2,628
Sq Ft
$221/Sq Ft
Est. Value
About This Home
This home is located at 3912 Orchard Spring Way, Virginia Beach, VA 23456 and is currently estimated at $579,875, approximately $220 per square foot. 3912 Orchard Spring Way is a home located in Virginia Beach City with nearby schools including Glenwood Elementary School, Salem Middle School, and Salem High School.
Ownership History
Date
Name
Owned For
Owner Type
Purchase Details
Closed on
Sep 14, 2007
Sold by
Centex Homes
Bought by
Tran Mythy T
Current Estimated Value
Home Financials for this Owner
Home Financials are based on the most recent Mortgage that was taken out on this home.
Original Mortgage
$337,666
Outstanding Balance
$215,207
Interest Rate
6.7%
Mortgage Type
New Conventional
Estimated Equity
$364,668
Create a Home Valuation Report for This Property
The Home Valuation Report is an in-depth analysis detailing your home's value as well as a comparison with similar homes in the area
Home Values in the Area
Average Home Value in this Area
Purchase History
| Date | Buyer | Sale Price | Title Company |
|---|---|---|---|
| Tran Mythy T | $422,083 | -- |
Source: Public Records
Mortgage History
| Date | Status | Borrower | Loan Amount |
|---|---|---|---|
| Open | Tran Mythy T | $337,666 |
Source: Public Records
Tax History Compared to Growth
Tax History
| Year | Tax Paid | Tax Assessment Tax Assessment Total Assessment is a certain percentage of the fair market value that is determined by local assessors to be the total taxable value of land and additions on the property. | Land | Improvement |
|---|---|---|---|---|
| 2025 | $4,610 | $531,000 | $180,000 | $351,000 |
| 2024 | $4,610 | $475,300 | $169,000 | $306,300 |
| 2023 | $4,530 | $457,600 | $144,000 | $313,600 |
| 2022 | $4,322 | $436,600 | $127,700 | $308,900 |
| 2021 | $3,656 | $369,300 | $116,100 | $253,200 |
| 2020 | $3,655 | $359,200 | $116,100 | $243,100 |
| 2019 | $3,632 | $330,800 | $113,400 | $217,400 |
| 2018 | $3,316 | $330,800 | $113,400 | $217,400 |
| 2017 | $3,316 | $330,800 | $113,400 | $217,400 |
| 2016 | $3,182 | $321,400 | $113,400 | $208,000 |
| 2015 | $3,088 | $311,900 | $113,400 | $198,500 |
| 2014 | $2,717 | $315,800 | $114,800 | $201,000 |
Source: Public Records
Map
Nearby Homes
- 4528 Medford Ct
- 4660 Indian River Rd
- 4668 Indian River Rd
- 1292 Raynor Dr
- 4325 Danali Ln
- 4337 Danali Ln
- 4740 Kilby Dr Unit 10
- 2008 Hopi Ct
- 1536 Drumheller Dr
- 2017 Southaven Dr
- 2601 Larchwood Cove
- 2148 Dove Ridge Dr
- 1981 Gravenhurst Dr
- 2100 Rydale Ct
- 1936 Southaven Dr
- 2020 Lyndora Rd
- 1341 Sagamore Ct
- 1232 Northvale Dr
- 1421 Eddystone Dr Unit X9192
- 4372 Hillcrest Farms Cir
- 3916 Orchard Spring Way
- 3908 Orchard Spring Way
- 3904 Orchard Spring Way
- 1409 Flyfisher Ct
- 3920 Orchard Spring Way
- 1405 Flyfisher Ct
- 1413 Flyfisher Ct
- 2501 Indian Orchard Ct
- 1417 Flyfisher Ct
- 2500 Mario Ct
- 3924 Orchard Spring Way
- LT 10B Flyfisher Ct
- LT 10A Flyfisher Ct
- 3900 Orchard Spring Way
- 1403 Flyfisher Ct
- 1421 Flyfisher Ct
- 2505 Indian Orchard Ct
- 2504 Mario Ct
- 2500 Indian Orchard Ct
- 3928 Orchard Spring Way