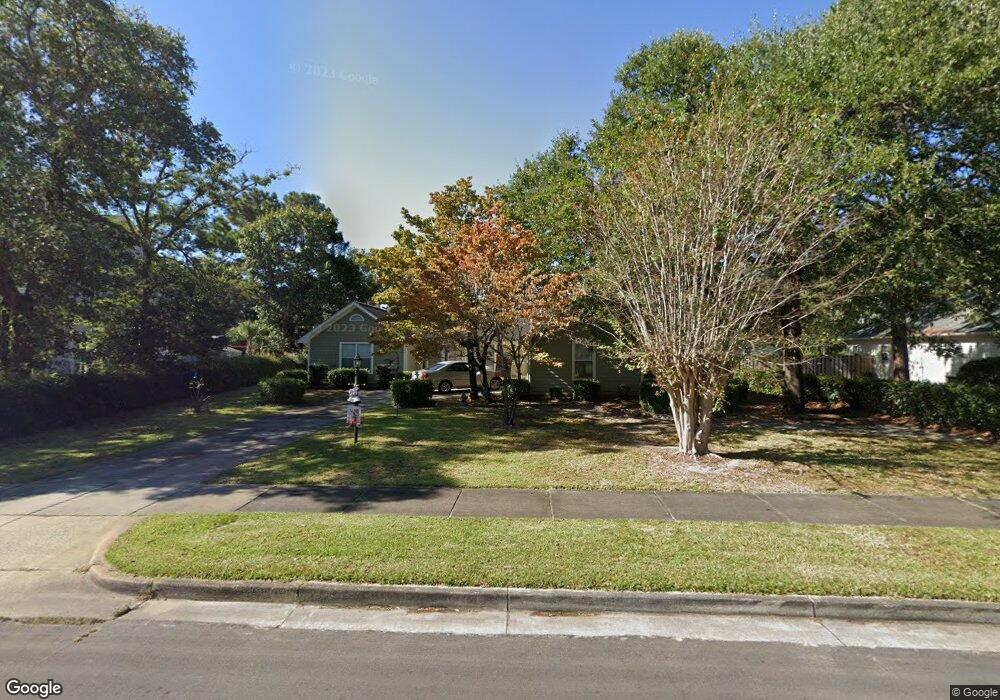
3912 W Durant Ct Wilmington, NC 28412
Carriage Hills NeighborhoodEstimated Value: $388,000 - $432,000
3
Beds
4
Baths
1,602
Sq Ft
$260/Sq Ft
Est. Value
About This Home
This home is located at 3912 W Durant Ct, Wilmington, NC 28412 and is currently estimated at $416,750, approximately $260 per square foot. 3912 W Durant Ct is a home located in New Hanover County with nearby schools including Pine Valley Elementary School, Williston Middle School, and Eugene Ashley High School.
Ownership History
Date
Name
Owned For
Owner Type
Purchase Details
Closed on
Feb 15, 2021
Sold by
Poole Cheryl Mintz and Poole Michael M
Bought by
Williams Tana Mintz and Williams Donald Jospeh
Current Estimated Value
Purchase Details
Closed on
Jan 15, 2009
Sold by
Williams Tana Mintz and Williams Donald Joseph
Bought by
Poole Cheryl Mintz
Purchase Details
Closed on
Nov 29, 2006
Sold by
Mintz Mable Loraine Skinner
Bought by
Poole Cheryl Mintz and Williams Tana Mintz
Purchase Details
Closed on
Dec 23, 1997
Sold by
Poole Michael M Cheryl M
Bought by
Mintz Mable S
Purchase Details
Closed on
May 29, 1997
Sold by
Skibsted Wesley G Jr June D
Bought by
Poole Michael M Cheryl M
Purchase Details
Closed on
Aug 28, 1992
Sold by
Pulte Home Corporation
Bought by
Skibsted Wesley G Jr June D
Purchase Details
Closed on
Feb 1, 1988
Sold by
Landmark Organization Inc
Bought by
Pulte Home Corporation
Purchase Details
Closed on
Jan 1, 1986
Bought by
Landmark Organization Inc
Create a Home Valuation Report for This Property
The Home Valuation Report is an in-depth analysis detailing your home's value as well as a comparison with similar homes in the area
Home Values in the Area
Average Home Value in this Area
Purchase History
| Date | Buyer | Sale Price | Title Company |
|---|---|---|---|
| Williams Tana Mintz | -- | None Available | |
| Williams Tana Mintz | -- | None Listed On Document | |
| Poole Cheryl Mintz | -- | None Available | |
| Poole Cheryl Mintz | -- | None Available | |
| Mintz Mable S | $102,500 | -- | |
| Poole Michael M Cheryl M | $133,000 | -- | |
| Skibsted Wesley G Jr June D | $15,000 | -- | |
| Pulte Home Corporation | $810,000 | -- | |
| Landmark Organization Inc | -- | -- |
Source: Public Records
Tax History Compared to Growth
Tax History
| Year | Tax Paid | Tax Assessment Tax Assessment Total Assessment is a certain percentage of the fair market value that is determined by local assessors to be the total taxable value of land and additions on the property. | Land | Improvement |
|---|---|---|---|---|
| 2025 | -- | $411,400 | $116,700 | $294,700 |
| 2024 | -- | $276,300 | $101,300 | $175,000 |
| 2023 | -- | $276,300 | $101,300 | $175,000 |
| 2022 | $0 | $276,300 | $101,300 | $175,000 |
| 2021 | $1,985 | $276,300 | $101,300 | $175,000 |
| 2020 | $1,985 | $188,400 | $45,000 | $143,400 |
| 2019 | $1,985 | $188,400 | $45,000 | $143,400 |
| 2018 | $0 | $188,400 | $45,000 | $143,400 |
| 2017 | $1,985 | $188,400 | $45,000 | $143,400 |
| 2016 | $1,717 | $155,000 | $50,000 | $105,000 |
| 2015 | $1,641 | $155,000 | $50,000 | $105,000 |
| 2014 | $1,572 | $155,000 | $50,000 | $105,000 |
Source: Public Records
Map
Nearby Homes
- 4001 E Durant Ct
- 3809 Habberline St
- 4414 Grey Oaks Ct
- 1035 Avenshire Cir
- 4422 Grey Oaks Ct
- 1001 Avenshire Cir
- 3847 Merestone Dr
- 905 Haymarket Ln
- 3669 Merestone Dr
- 801 Saint Andrews Dr
- 912 Taliga Ln
- 842 Ruffin St
- 819 Ruffin St
- 1103 Groppo Cove
- 4432 Regent Dr
- 1106 Groppo Cove
- 4426 Quail Ct
- 1006 Ryans Ct
- 1035 Summerlin Falls Ct
- 4117 Breezewood Dr Unit 204
- 3910 W Durant Ct
- 3901 New Holland Dr
- 3903 New Holland Dr
- 3807 New Holland Dr
- 3905 New Holland Dr
- 3908 W Durant Ct
- 3913 W Durant Ct
- 3911 W Durant Ct
- 4002 E Durant Ct
- 3805 New Holland Dr
- 3909 W Durant Ct
- 3906 W Durant Ct
- 3808 New Holland Dr
- 1202 Yardley Ln
- 3902 New Holland Dr
- 3904 New Holland Dr
- 3806 New Holland Dr
- 3803 New Holland Dr
- 4004 E Durant Ct
- 3906 New Holland Dr