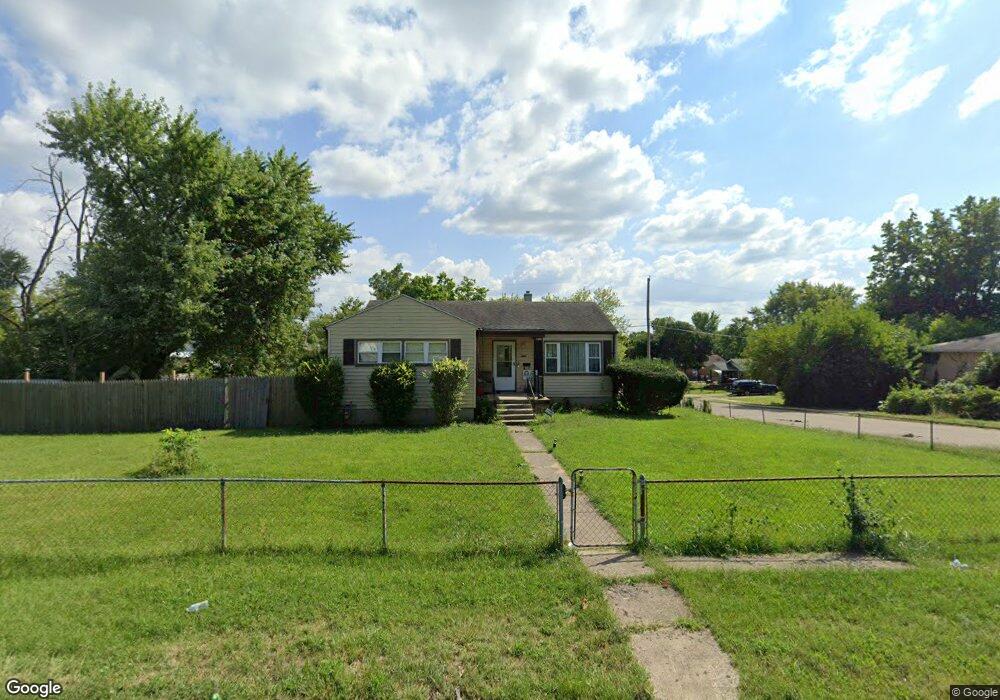
3912 W Hillcrest Ave Dayton, OH 45406
Fort McKinley NeighborhoodEstimated Value: $96,000 - $120,000
3
Beds
2
Baths
1,581
Sq Ft
$67/Sq Ft
Est. Value
About This Home
This home is located at 3912 W Hillcrest Ave, Dayton, OH 45406 and is currently estimated at $106,108, approximately $67 per square foot. 3912 W Hillcrest Ave is a home located in Montgomery County with nearby schools including Valerie Elementary School, Imagine Klepinger Road Community School, and North Dayton School of Science & Discovery.
Ownership History
Date
Name
Owned For
Owner Type
Purchase Details
Closed on
Apr 22, 2020
Sold by
Neal Frederick E O and Patterson Maxine J
Bought by
Cox Antionette Laflora
Current Estimated Value
Home Financials for this Owner
Home Financials are based on the most recent Mortgage that was taken out on this home.
Original Mortgage
$53,021
Outstanding Balance
$47,059
Interest Rate
3.5%
Mortgage Type
FHA
Estimated Equity
$59,050
Purchase Details
Closed on
Feb 12, 2019
Sold by
Estate Of Lamargie Glenn O Neal
Bought by
Neal Frederick O and Patterson Maxine J
Purchase Details
Closed on
Jul 31, 2017
Sold by
Harper Nesby Celeste and Nesby Anthony
Bought by
Neal Fred O and Estate Of Larmargie Glenn O Neal
Purchase Details
Closed on
Oct 31, 2016
Sold by
Oneal Fred and Estate Of Lamargie Glenn O Nea
Bought by
Harper Lora and Harper Nesby Celeste
Purchase Details
Closed on
Nov 15, 1993
Sold by
Brice Ezra L and Brice Rosalind H
Bought by
Oneal Charlie W and Oneal Lamargie
Create a Home Valuation Report for This Property
The Home Valuation Report is an in-depth analysis detailing your home's value as well as a comparison with similar homes in the area
Home Values in the Area
Average Home Value in this Area
Purchase History
| Date | Buyer | Sale Price | Title Company |
|---|---|---|---|
| Cox Antionette Laflora | $54,000 | Partners Land Title Agency | |
| Neal Frederick O | -- | None Available | |
| Neal Fred O | $12,000 | None Available | |
| Harper Lora | $12,000 | None Available | |
| Oneal Charlie W | -- | -- |
Source: Public Records
Mortgage History
| Date | Status | Borrower | Loan Amount |
|---|---|---|---|
| Open | Cox Antionette Laflora | $53,021 |
Source: Public Records
Tax History Compared to Growth
Tax History
| Year | Tax Paid | Tax Assessment Tax Assessment Total Assessment is a certain percentage of the fair market value that is determined by local assessors to be the total taxable value of land and additions on the property. | Land | Improvement |
|---|---|---|---|---|
| 2024 | $1,054 | $12,580 | $4,600 | $7,980 |
| 2023 | $1,054 | $12,580 | $4,600 | $7,980 |
| 2022 | $969 | $9,680 | $3,540 | $6,140 |
| 2021 | $1,115 | $9,680 | $3,540 | $6,140 |
| 2020 | $892 | $8,940 | $3,540 | $5,400 |
| 2019 | $1,004 | $8,850 | $3,180 | $5,670 |
| 2018 | $1,005 | $8,850 | $3,180 | $5,670 |
| 2017 | $1,612 | $14,750 | $3,180 | $11,570 |
| 2016 | $894 | $16,550 | $3,540 | $13,010 |
| 2015 | $781 | $16,550 | $3,540 | $13,010 |
| 2014 | $781 | $16,550 | $3,540 | $13,010 |
| 2012 | -- | $15,790 | $5,380 | $10,410 |
Source: Public Records
Map
Nearby Homes
- 2417 Wheeler Ave
- 2212 Chamberlin Ave
- 3748 Saint James Ave
- 3593 Saint James Ave
- 2620 N Gettysburg Ave
- 2726 Wentworth Ave
- 2145 Kipling Dr
- 4445 Prescott Ave
- Lot#25 Glenbrook Dr
- Lot#1 Glenbrook Dr
- Lot#24 Glenbrook Dr
- Lot#21 Glenbrook Dr
- 3801 Salem Ave
- 2127 Kensington Dr
- 2200 Kensington Dr
- 2150 Kensington Dr
- LOT#26 Glenbrook Dr
- 4541 Waymire Ave
- 3740 Kings Hwy
- 4651 Christopher Ave
- 2240 Esmeralda Ave
- 3904 W Hillcrest Ave
- 2235 Esmeralda Ave
- 2233 Deering Ave
- 2239 Esmeralda Ave
- 3909 W Hillcrest Ave
- 2242 Esmeralda Ave
- 4015 W Hillcrest Ave
- 2241 Esmeralda Ave
- 3907 W Hillcrest Ave
- 2229 Deering Ave
- 4051 W Hillcrest Ave
- 2244 Esmeralda Ave
- 2225 Deering Ave
- 3905 W Hillcrest Ave
- 3838 W Hillcrest Ave
- 2244 Falmouth Ave
- 2240 Falmouth Ave
- 2412 Hancock Ave
- 2409 Hancock Ave