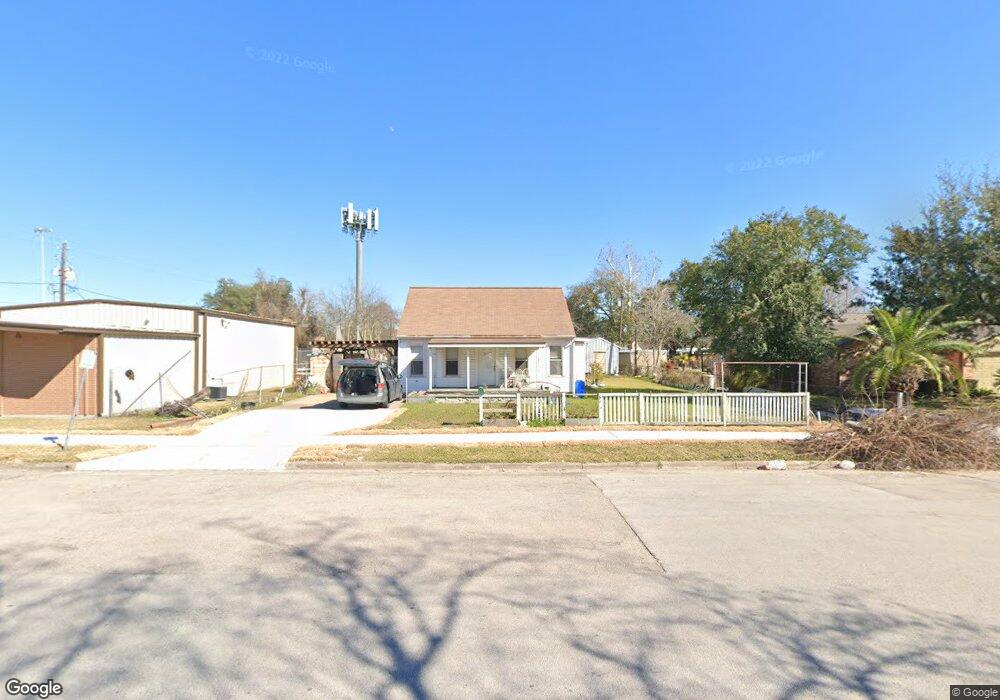
3913 Dover St Houston, TX 77087
Golfcrest-Bellfort-Reveille NeighborhoodEstimated Value: $183,394 - $217,000
3
Beds
1
Bath
1,508
Sq Ft
$134/Sq Ft
Est. Value
About This Home
This home is located at 3913 Dover St, Houston, TX 77087 and is currently estimated at $202,099, approximately $134 per square foot. 3913 Dover St is a home located in Harris County with nearby schools including Park Place Elementary School, Daniel Ortiz Middle School, and Chavez High School.
Ownership History
Date
Name
Owned For
Owner Type
Purchase Details
Closed on
May 15, 2017
Sold by
Frazier Bernard R and Frazier Elizabeth
Bought by
Lukesie Darrell and Lukesie Maria
Current Estimated Value
Purchase Details
Closed on
May 25, 2004
Sold by
Nguyen Thu and Luu Kim Thuy
Bought by
Nguyen Nghiem
Home Financials for this Owner
Home Financials are based on the most recent Mortgage that was taken out on this home.
Original Mortgage
$61,481
Interest Rate
5.93%
Mortgage Type
Seller Take Back
Purchase Details
Closed on
Oct 17, 1997
Sold by
Luu Nang Chi
Bought by
Luu Thuy Kim
Purchase Details
Closed on
Jul 12, 1996
Sold by
Cortez Richard and Cortez Maria
Bought by
Nguyen Thu
Home Financials for this Owner
Home Financials are based on the most recent Mortgage that was taken out on this home.
Original Mortgage
$15,000
Interest Rate
8.41%
Mortgage Type
Seller Take Back
Create a Home Valuation Report for This Property
The Home Valuation Report is an in-depth analysis detailing your home's value as well as a comparison with similar homes in the area
Home Values in the Area
Average Home Value in this Area
Purchase History
| Date | Buyer | Sale Price | Title Company |
|---|---|---|---|
| Lukesie Darrell | -- | Stewart Title | |
| Nguyen Nghiem | -- | American Title Co | |
| Luu Thuy Kim | -- | -- | |
| Nguyen Thu | -- | Texas American Title Company |
Source: Public Records
Mortgage History
| Date | Status | Borrower | Loan Amount |
|---|---|---|---|
| Previous Owner | Nguyen Nghiem | $61,481 | |
| Previous Owner | Nguyen Thu | $15,000 |
Source: Public Records
Tax History Compared to Growth
Tax History
| Year | Tax Paid | Tax Assessment Tax Assessment Total Assessment is a certain percentage of the fair market value that is determined by local assessors to be the total taxable value of land and additions on the property. | Land | Improvement |
|---|---|---|---|---|
| 2025 | $2,634 | $164,000 | $64,500 | $99,500 |
| 2024 | $2,634 | $167,702 | $64,500 | $103,202 |
| 2023 | $2,634 | $164,660 | $64,500 | $100,160 |
| 2022 | $2,616 | $157,792 | $64,500 | $93,292 |
| 2021 | $2,518 | $142,320 | $45,150 | $97,170 |
| 2020 | $2,378 | $98,203 | $36,120 | $62,083 |
| 2019 | $2,393 | $94,558 | $36,120 | $58,438 |
| 2018 | $1,622 | $94,558 | $36,120 | $58,438 |
| 2017 | $2,356 | $94,558 | $36,120 | $58,438 |
| 2016 | $2,142 | $89,262 | $36,120 | $53,142 |
| 2015 | $1,412 | $77,000 | $36,120 | $40,880 |
| 2014 | $1,412 | $77,000 | $36,120 | $40,880 |
Source: Public Records
Map
Nearby Homes
- 0 Dover St Unit 39828065
- 7909 Dixie Dr
- 3743 Erie St
- 3727 Broadway St
- 8135 Glenbrook Dr
- 8124 Glenbrook Dr
- 7758 Hereford St
- 7734 El Rancho St
- 3607 De Leon St
- 7735 Oak Vista St
- 7937 Grafton St
- 7802 Santa Elena St
- 7846 Santa Elena St
- 7659 Greenstone St
- 8250 Park Place Blvd Unit 303
- 3731 Reveille St
- 8023 Findlay St
- 7936 Grove Ridge Dr
- 7908 Grove Ridge Dr
- 7954 Grove Ridge Dr
- 3915 Dover St
- 3917 Dover St
- 3920 Erie St
- 3920 Erie St
- 3926 Erie St
- 8006 Park Place Blvd
- 3919 Dover St
- 3930 Erie St
- 3914 Dover St
- 3920 Dover St
- 3912 Dover St
- 8018 Park Place Blvd
- 3934 Erie St
- 3922 Dover St
- 3923 Dover St
- 0 Dover St Unit 61216805
- 0 Dover St Unit 596251
- 0 Dover St Unit 26134764
- 0 Dover St Unit 32786248
- 0 Dover St Unit 65734147