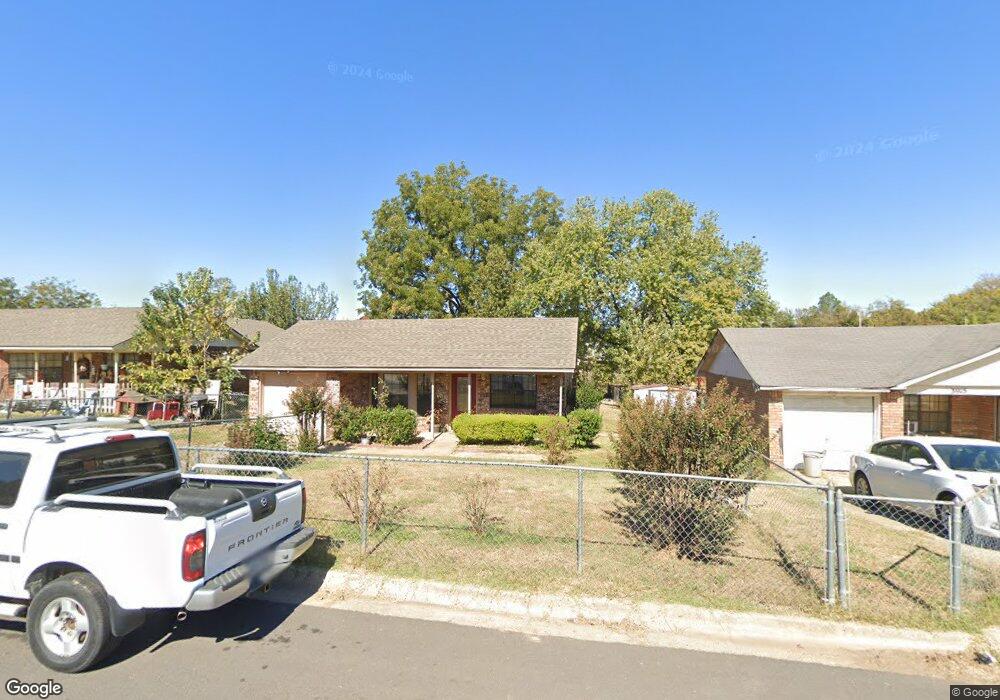
3913 James Ct van Buren, AR 72956
Estimated Value: $132,109 - $151,000
--
Bed
2
Baths
996
Sq Ft
$145/Sq Ft
Est. Value
About This Home
This home is located at 3913 James Ct, van Buren, AR 72956 and is currently estimated at $144,527, approximately $145 per square foot. 3913 James Ct is a home located in Crawford County with nearby schools including King Elementary School, Butterfield Trail Middle School, and Van Buren High School.
Ownership History
Date
Name
Owned For
Owner Type
Purchase Details
Closed on
Nov 7, 2008
Sold by
Rocha Manuel Antonio and Rocha Juana Marie
Bought by
Fajardo Deisy E
Current Estimated Value
Home Financials for this Owner
Home Financials are based on the most recent Mortgage that was taken out on this home.
Original Mortgage
$69,597
Outstanding Balance
$45,496
Interest Rate
6.08%
Mortgage Type
FHA
Estimated Equity
$99,031
Purchase Details
Closed on
Jul 2, 1997
Bought by
Nielsen and Jeremiah-Rocha
Purchase Details
Closed on
Jun 23, 1997
Bought by
Ar Valley-Nielsen and Ar Jeremiah
Purchase Details
Closed on
Mar 4, 1987
Bought by
River Edge-Taylor
Create a Home Valuation Report for This Property
The Home Valuation Report is an in-depth analysis detailing your home's value as well as a comparison with similar homes in the area
Home Values in the Area
Average Home Value in this Area
Purchase History
| Date | Buyer | Sale Price | Title Company |
|---|---|---|---|
| Fajardo Deisy E | -- | None Available | |
| Nielsen | -- | -- | |
| Ar Valley-Nielsen | -- | -- | |
| River Edge-Taylor | -- | -- |
Source: Public Records
Mortgage History
| Date | Status | Borrower | Loan Amount |
|---|---|---|---|
| Open | Fajardo Deisy E | $69,597 |
Source: Public Records
Tax History Compared to Growth
Tax History
| Year | Tax Paid | Tax Assessment Tax Assessment Total Assessment is a certain percentage of the fair market value that is determined by local assessors to be the total taxable value of land and additions on the property. | Land | Improvement |
|---|---|---|---|---|
| 2025 | $102 | $17,510 | $3,000 | $14,510 |
| 2024 | $171 | $17,510 | $3,000 | $14,510 |
| 2023 | $216 | $17,510 | $3,000 | $14,510 |
| 2022 | $235 | $11,760 | $2,000 | $9,760 |
| 2021 | $235 | $11,760 | $2,000 | $9,760 |
| 2020 | $235 | $11,760 | $2,000 | $9,760 |
| 2019 | $235 | $11,760 | $2,000 | $9,760 |
| 2018 | $260 | $11,760 | $2,000 | $9,760 |
| 2017 | $260 | $11,760 | $2,000 | $9,760 |
| 2016 | $260 | $11,760 | $2,000 | $9,760 |
| 2015 | $225 | $11,760 | $2,000 | $9,760 |
| 2014 | $225 | $11,760 | $2,000 | $9,760 |
Source: Public Records
Map
Nearby Homes