Estimated Value: $146,000 - $210,000
3
Beds
1
Bath
1,051
Sq Ft
$164/Sq Ft
Est. Value
About This Home
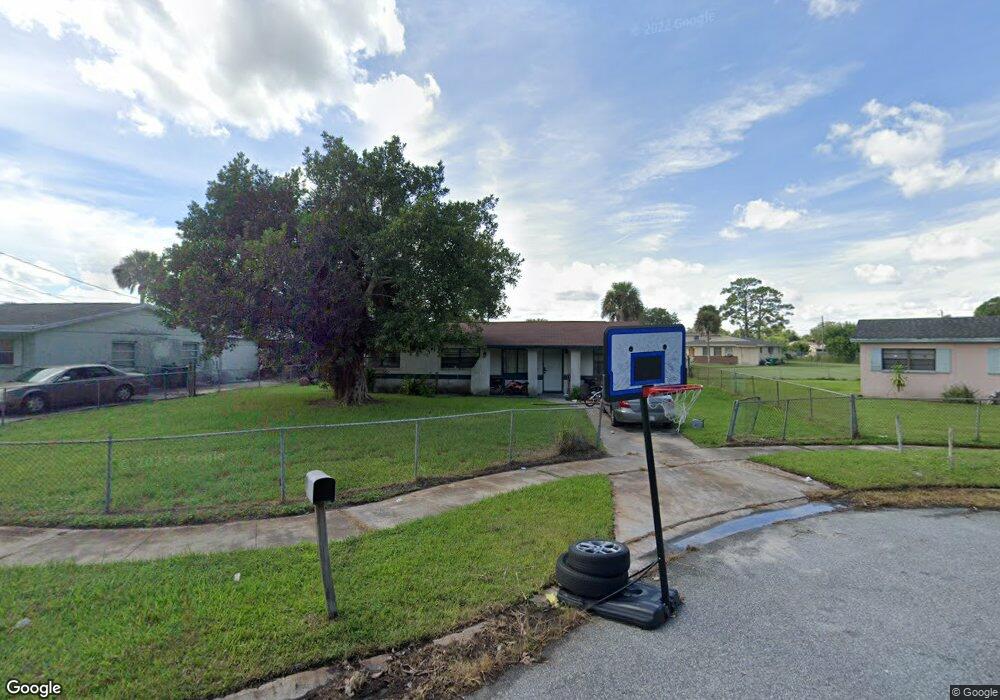
This home is located at 3913 Magnolia Ct, Cocoa, FL 32926 and is currently estimated at $172,569, approximately $164 per square foot. 3913 Magnolia Ct is a home located in Brevard County with nearby schools including Saturn Elementary School, Ronald McNair Magnet Middle School, and Rockledge Senior High School.
Ownership History
Date
Name
Owned For
Owner Type
Purchase Details
Closed on
Oct 11, 2023
Sold by
Martin Larry A
Bought by
Afro City Llc
Current Estimated Value
Purchase Details
Closed on
Feb 21, 1995
Sold by
Dept Housing & Urban Dev
Bought by
Martin Larry A
Purchase Details
Closed on
Jul 23, 1994
Sold by
Clerk Circuit Court
Bought by
Bancboston Mtg Corp and Stockton Whatley Davin & Co
Purchase Details
Closed on
Jul 22, 1994
Sold by
Bancboson Mtg Corp
Bought by
Housing & Urban Dev
Purchase Details
Closed on
Oct 1, 1992
Sold by
Hamilton Thomas Ronnie and Hamilton Deborah Ann
Bought by
Hamilton Thomas Ronnie
Create a Home Valuation Report for This Property
The Home Valuation Report is an in-depth analysis detailing your home's value as well as a comparison with similar homes in the area
Home Values in the Area
Average Home Value in this Area
Purchase History
| Date | Buyer | Sale Price | Title Company |
|---|---|---|---|
| Afro City Llc | $100 | None Listed On Document | |
| Martin Larry A | $17,800 | -- | |
| Bancboston Mtg Corp | -- | -- | |
| Housing & Urban Dev | -- | -- | |
| Hamilton Thomas Ronnie | $12,500 | -- |
Source: Public Records
Tax History Compared to Growth
Tax History
| Year | Tax Paid | Tax Assessment Tax Assessment Total Assessment is a certain percentage of the fair market value that is determined by local assessors to be the total taxable value of land and additions on the property. | Land | Improvement |
|---|---|---|---|---|
| 2025 | $2,050 | $124,650 | -- | -- |
| 2024 | $1,695 | $125,120 | -- | -- |
| 2023 | $1,695 | $120,040 | $35,000 | $85,040 |
| 2022 | $1,452 | $99,520 | $0 | $0 |
| 2021 | $1,221 | $57,380 | $11,000 | $46,380 |
| 2020 | $1,209 | $57,830 | $11,000 | $46,830 |
| 2019 | $1,175 | $57,580 | $11,000 | $46,580 |
| 2018 | $1,146 | $55,840 | $11,000 | $44,840 |
| 2017 | $1,082 | $48,170 | $11,000 | $37,170 |
| 2016 | $1,060 | $46,080 | $11,000 | $35,080 |
| 2015 | $990 | $40,140 | $11,000 | $29,140 |
| 2014 | $970 | $38,360 | $11,000 | $27,360 |
Source: Public Records
Map
Nearby Homes