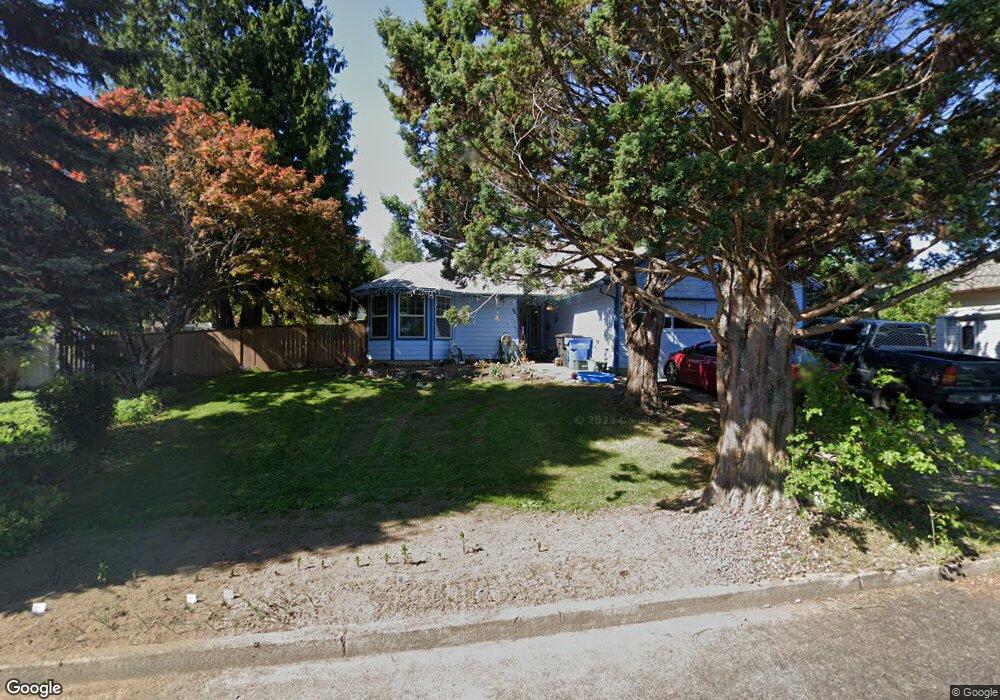
3913 R St Washougal, WA 98671
Estimated Value: $457,000 - $555,000
3
Beds
3
Baths
1,390
Sq Ft
$359/Sq Ft
Est. Value
About This Home
This home is located at 3913 R St, Washougal, WA 98671 and is currently estimated at $498,469, approximately $358 per square foot. 3913 R St is a home located in Clark County with nearby schools including Gause Elementary School, Jemtegaard Middle School, and Washougal High School.
Ownership History
Date
Name
Owned For
Owner Type
Purchase Details
Closed on
Nov 6, 2020
Sold by
White David A
Bought by
Chartand Miranda and Seevers Sandy
Current Estimated Value
Home Financials for this Owner
Home Financials are based on the most recent Mortgage that was taken out on this home.
Original Mortgage
$14,920
Outstanding Balance
$13,272
Interest Rate
2.78%
Mortgage Type
New Conventional
Estimated Equity
$485,197
Purchase Details
Closed on
Nov 22, 2011
Sold by
White David A
Bought by
White David A and White Linda E
Purchase Details
Closed on
Mar 19, 2009
Sold by
White Mary V and White David A
Bought by
White Mary and White David A
Purchase Details
Closed on
Sep 12, 2006
Sold by
White Mary V and White Theodore
Bought by
White Mary and White Theodore
Create a Home Valuation Report for This Property
The Home Valuation Report is an in-depth analysis detailing your home's value as well as a comparison with similar homes in the area
Home Values in the Area
Average Home Value in this Area
Purchase History
| Date | Buyer | Sale Price | Title Company |
|---|---|---|---|
| Chartand Miranda | $379,900 | Fidelity Natl Ttl Co Of Wa I | |
| White David A | -- | None Available | |
| White Mary | -- | None Available | |
| White Mary | -- | None Available |
Source: Public Records
Mortgage History
| Date | Status | Borrower | Loan Amount |
|---|---|---|---|
| Open | Chartand Miranda | $14,920 | |
| Open | Chartand Miranda | $373,018 |
Source: Public Records
Tax History Compared to Growth
Tax History
| Year | Tax Paid | Tax Assessment Tax Assessment Total Assessment is a certain percentage of the fair market value that is determined by local assessors to be the total taxable value of land and additions on the property. | Land | Improvement |
|---|---|---|---|---|
| 2025 | $3,781 | $390,861 | $120,000 | $270,861 |
| 2024 | $3,693 | $398,376 | $144,000 | $254,376 |
| 2023 | $3,607 | $407,133 | $154,800 | $252,333 |
| 2022 | $3,567 | $389,410 | $154,800 | $234,610 |
| 2021 | $3,445 | $334,252 | $132,000 | $202,252 |
| 2020 | $3,300 | $302,954 | $120,000 | $182,954 |
| 2019 | $2,865 | $294,840 | $120,000 | $174,840 |
| 2018 | $3,033 | $270,604 | $0 | $0 |
| 2017 | $2,608 | $236,449 | $0 | $0 |
| 2016 | $2,522 | $223,323 | $0 | $0 |
| 2015 | $2,433 | $197,405 | $0 | $0 |
| 2014 | -- | $189,543 | $0 | $0 |
| 2013 | -- | $166,938 | $0 | $0 |
Source: Public Records
Map
Nearby Homes