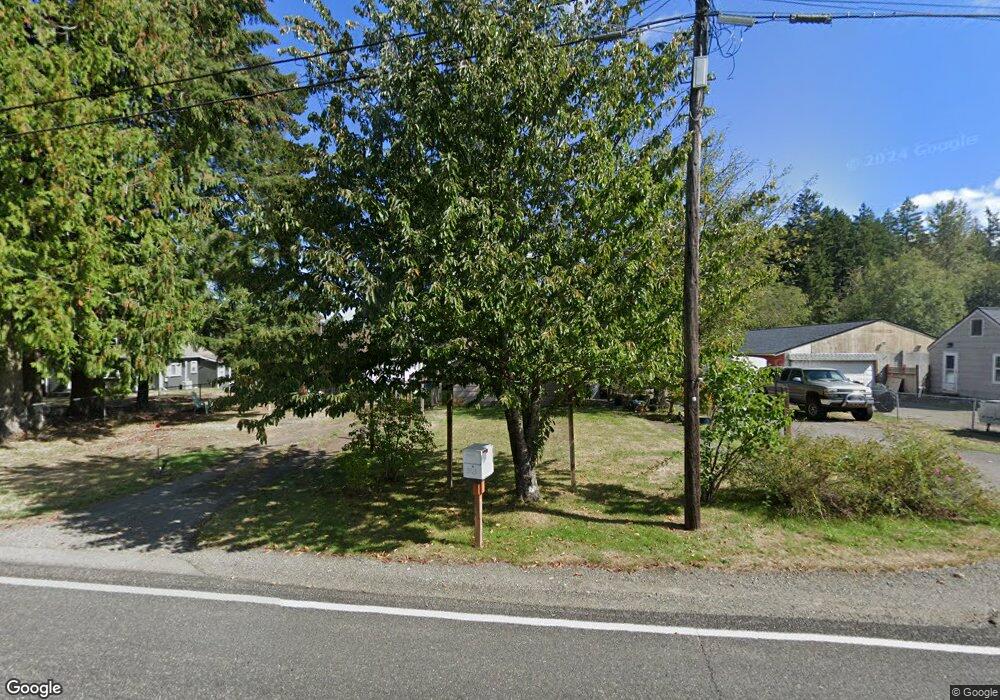
3913 Sunnyslope Rd SW Port Orchard, WA 98367
Estimated Value: $291,000 - $429,000
2
Beds
1
Bath
1,137
Sq Ft
$330/Sq Ft
Est. Value
About This Home
This home is located at 3913 Sunnyslope Rd SW, Port Orchard, WA 98367 and is currently estimated at $375,392, approximately $330 per square foot. 3913 Sunnyslope Rd SW is a home located in Kitsap County with nearby schools including Sunnyslope Elementary School, Cedar Heights Middle School, and South Kitsap High School.
Ownership History
Date
Name
Owned For
Owner Type
Purchase Details
Closed on
Jul 22, 1997
Sold by
Va
Bought by
Leckband Marty and Leckband Donna
Current Estimated Value
Home Financials for this Owner
Home Financials are based on the most recent Mortgage that was taken out on this home.
Original Mortgage
$57,500
Outstanding Balance
$8,386
Interest Rate
7.7%
Mortgage Type
Seller Take Back
Estimated Equity
$367,006
Purchase Details
Closed on
Jan 27, 1997
Sold by
Nationsbanc Mtg Corp
Bought by
Va
Home Financials for this Owner
Home Financials are based on the most recent Mortgage that was taken out on this home.
Original Mortgage
$64,800
Interest Rate
7.46%
Mortgage Type
Seller Take Back
Purchase Details
Closed on
Jan 14, 1997
Sold by
Griffin Gayland G and Griffin Nadine L
Bought by
Nationsbanc Mtg Corp and Keycorp Mtg Inc
Home Financials for this Owner
Home Financials are based on the most recent Mortgage that was taken out on this home.
Original Mortgage
$64,800
Interest Rate
7.46%
Mortgage Type
Seller Take Back
Create a Home Valuation Report for This Property
The Home Valuation Report is an in-depth analysis detailing your home's value as well as a comparison with similar homes in the area
Home Values in the Area
Average Home Value in this Area
Purchase History
| Date | Buyer | Sale Price | Title Company |
|---|---|---|---|
| Leckband Marty | -- | Transnation Title Insurance | |
| Va | -- | Transnation Title Ins | |
| Nationsbanc Mtg Corp | $56,199 | Transnation Title Ins Co |
Source: Public Records
Mortgage History
| Date | Status | Borrower | Loan Amount |
|---|---|---|---|
| Open | Leckband Marty | $57,500 | |
| Previous Owner | Nationsbanc Mtg Corp | $64,800 |
Source: Public Records
Tax History Compared to Growth
Tax History
| Year | Tax Paid | Tax Assessment Tax Assessment Total Assessment is a certain percentage of the fair market value that is determined by local assessors to be the total taxable value of land and additions on the property. | Land | Improvement |
|---|---|---|---|---|
| 2026 | $2,544 | $283,510 | $74,010 | $209,500 |
| 2025 | $2,544 | $283,510 | $74,010 | $209,500 |
| 2024 | $2,468 | $283,510 | $74,010 | $209,500 |
| 2023 | $2,450 | $283,510 | $74,010 | $209,500 |
| 2022 | $2,353 | $227,910 | $58,990 | $168,920 |
| 2021 | $2,244 | $205,780 | $53,630 | $152,150 |
| 2020 | $1,979 | $175,350 | $58,290 | $117,060 |
| 2019 | $1,685 | $163,080 | $53,880 | $109,200 |
| 2018 | $1,793 | $134,630 | $46,370 | $88,260 |
| 2017 | $1,531 | $134,630 | $46,370 | $88,260 |
| 2016 | $1,531 | $121,940 | $44,160 | $77,780 |
| 2015 | $1,485 | $119,850 | $44,160 | $75,690 |
| 2014 | -- | $105,780 | $43,790 | $61,990 |
| 2013 | -- | $113,740 | $51,750 | $61,990 |
Source: Public Records
Map
Nearby Homes
- 6102 Crestner Dr SW
- 6080 Crestner Dr SW
- 6070 Crestner Dr SW
- 6054 Trace Dr SW
- 6013 Trace Dr SW Unit 456
- 6014 Trace Dr SW
- 5894 Trace Dr SW
- 5763 Trace Dr SW
- 5733 Trace Dr SW
- 5846 SW 44th St
- 4520 Victory Place SW
- 4838 Victory Dr SW
- 6150 SW Rhododendron Dr
- 5131 Southgate Dr SW
- 7420 Washington 3 Unit 31
- 4402 Lone Bear Ln SW
- 4833 Lone Bear Ln SW
- 4310 Novak Dr SW
- 6240 SW Old Clifton Rd
- 5925 Addison Rd SW Unit 100
- 3889 Sunnyslope Rd SW
- 3955 Sunnyslope Rd SW
- 3966 Sunnyslope Rd SW
- 3920 Sunnyslope Rd SW
- 3851 Sunnyslope Rd SW
- 3995 Sunnyslope Rd SW
- 3884 Sunnyslope Rd SW
- 3990 Sunnyslope Rd SW
- 4010 Sunnyslope Rd SW
- 3800 Sunnyslope Rd SW
- 6263 SW Bob Ct
- 3732 Sunnyslope Rd SW
- 4056 Sunnyslope Rd SW
- 4104 Sunnyslope Rd SW
- 3715 Sunnyslope Rd SW
- 4080 Sunnyslope Rd SW
- 4093 Sunnyslope Rd SW
- 6070 Crestner Dr SW Unit 436
- 4124 Sunnyslope Rd SW
- 4169 Sunnyslope Rd SW