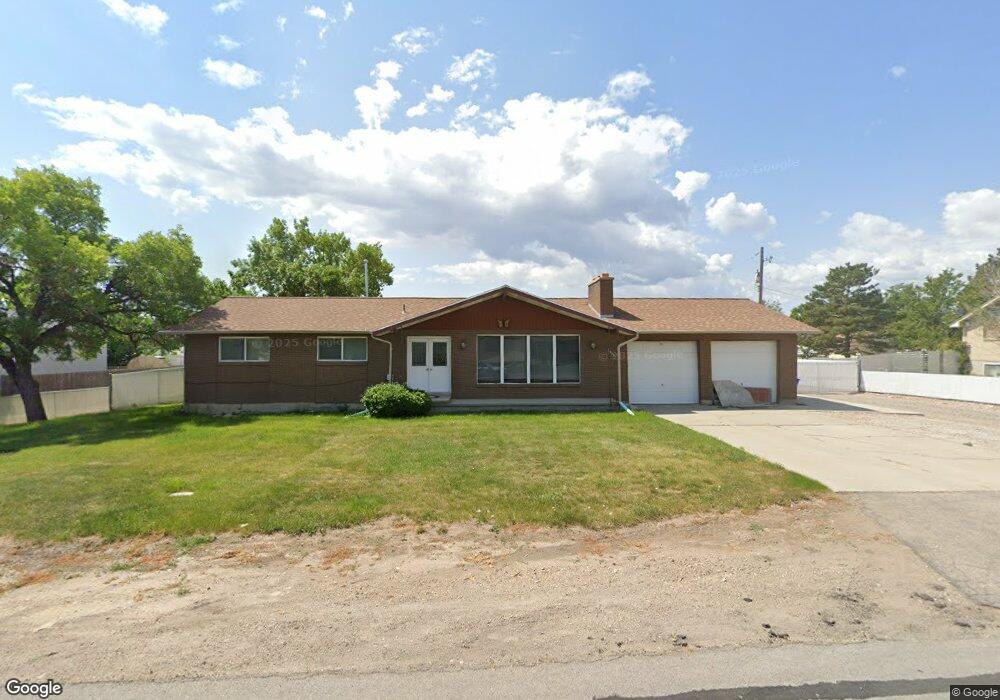
3913 W 8350 S West Jordan, UT 84088
Jordan Oaks NeighborhoodEstimated Value: $781,000 - $981,000
6
Beds
3
Baths
3,060
Sq Ft
$273/Sq Ft
Est. Value
About This Home
This home is located at 3913 W 8350 S, West Jordan, UT 84088 and is currently estimated at $836,419, approximately $273 per square foot. 3913 W 8350 S is a home located in Salt Lake County with nearby schools including Columbia Elementary School, Joel P. Jensen Middle School, and West Jordan High School.
Ownership History
Date
Name
Owned For
Owner Type
Purchase Details
Closed on
Oct 9, 2014
Sold by
Malcolm Morris Keith and Malcolm Lois
Bought by
Faber Lamont and Faber Justin
Current Estimated Value
Create a Home Valuation Report for This Property
The Home Valuation Report is an in-depth analysis detailing your home's value as well as a comparison with similar homes in the area
Home Values in the Area
Average Home Value in this Area
Purchase History
| Date | Buyer | Sale Price | Title Company |
|---|---|---|---|
| Faber Lamont | -- | First American Title |
Source: Public Records
Tax History Compared to Growth
Tax History
| Year | Tax Paid | Tax Assessment Tax Assessment Total Assessment is a certain percentage of the fair market value that is determined by local assessors to be the total taxable value of land and additions on the property. | Land | Improvement |
|---|---|---|---|---|
| 2025 | $3,648 | $751,600 | $281,200 | $470,400 |
| 2024 | $3,648 | $701,800 | $270,400 | $431,400 |
| 2023 | $3,780 | $667,700 | $267,800 | $399,900 |
| 2022 | $3,780 | $674,400 | $262,500 | $411,900 |
| 2021 | $3,043 | $494,100 | $218,800 | $275,300 |
| 2020 | $3,024 | $460,900 | $218,800 | $242,100 |
| 2019 | $2,973 | $444,300 | $183,800 | $260,500 |
| 2018 | $0 | $412,900 | $171,200 | $241,700 |
| 2017 | $2,641 | $389,700 | $171,200 | $218,500 |
| 2016 | $2,298 | $318,600 | $171,200 | $147,400 |
| 2015 | $2,405 | $325,200 | $174,300 | $150,900 |
| 2014 | -- | $292,200 | $158,000 | $134,200 |
Source: Public Records
Map
Nearby Homes
- 8400 S 4000 W Unit 134
- 3977 W Elwood Way
- 8461 S Meadowlark Ln
- 3888 W 8700 S
- 3931 W Dansere Cir
- 7991 S 3725 W
- 7989 S 3725 W
- 8180 S Old Bingham Hwy
- 3546 W 7980 S
- 3647 W 7865 S
- 3629 W 7825 S
- 8058 S Lismore Ln Unit 304
- 8983 S 3860 W
- 3476 W Spaulding Rd
- 3332 Lower Newark Way
- 8359 Etude Dr
- 8941 S Sun Leaf Dr
- 8493 S 3200 W
- 7973 S Nebo Dr
- 3112 Green Acre Dr