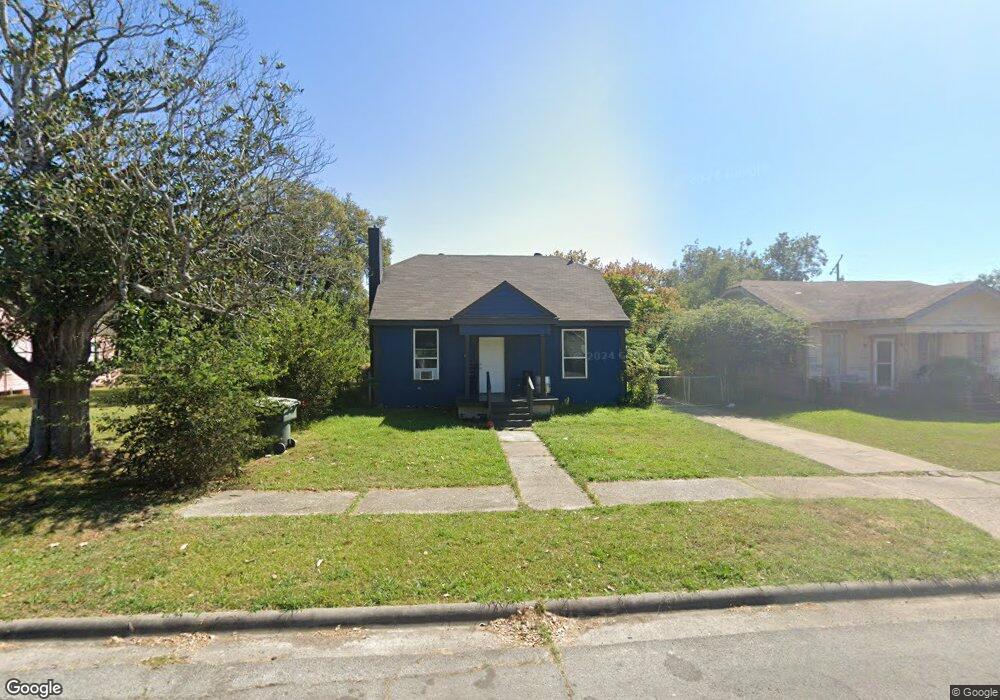
3914 5th St Port Arthur, TX 77642
Estimated Value: $93,000 - $124,000
--
Bed
--
Bath
--
Sq Ft
6,752
Sq Ft Lot
About This Home
Property Id: 1245490
Freshly renovated garage apartment with new appliances available for for move in as of 8/17!
Sec 8 ok!
Ownership History
Date
Name
Owned For
Owner Type
Purchase Details
Closed on
Feb 10, 2025
Sold by
Pipeline Financial Group Llc
Bought by
Lone Star Neighborhood Development Llc
Current Estimated Value
Home Financials for this Owner
Home Financials are based on the most recent Mortgage that was taken out on this home.
Original Mortgage
$93,400
Interest Rate
6.93%
Mortgage Type
New Conventional
Purchase Details
Closed on
Mar 11, 2022
Sold by
Guerrero Jesus N
Bought by
Pipeline Financial Group Llc
Purchase Details
Closed on
Nov 13, 2017
Sold by
Schrader Caraig S and Schrader Peggy I
Bought by
Guerrero Jesus N
Create a Home Valuation Report for This Property
The Home Valuation Report is an in-depth analysis detailing your home's value as well as a comparison with similar homes in the area
Home Values in the Area
Average Home Value in this Area
Purchase History
| Date | Buyer | Sale Price | Title Company |
|---|---|---|---|
| Lone Star Neighborhood Development Llc | -- | None Listed On Document | |
| Pipeline Financial Group Llc | -- | Stewart Title | |
| Guerrero Jesus N | -- | None Available |
Source: Public Records
Mortgage History
| Date | Status | Borrower | Loan Amount |
|---|---|---|---|
| Previous Owner | Lone Star Neighborhood Development Llc | $93,400 |
Source: Public Records
Property History
| Date | Event | Price | List to Sale | Price per Sq Ft |
|---|---|---|---|---|
| 10/08/2024 10/08/24 | Off Market | $500 | -- | -- |
| 09/05/2024 09/05/24 | For Rent | $500 | -- | -- |
Tax History Compared to Growth
Tax History
| Year | Tax Paid | Tax Assessment Tax Assessment Total Assessment is a certain percentage of the fair market value that is determined by local assessors to be the total taxable value of land and additions on the property. | Land | Improvement |
|---|---|---|---|---|
| 2025 | $2,650 | $92,610 | $6,750 | $85,860 |
| 2024 | $2,650 | $92,503 | $2,910 | $89,593 |
| 2023 | $2,650 | $81,304 | $2,910 | $78,394 |
| 2022 | $1,492 | $46,987 | $2,910 | $44,077 |
| 2021 | $1,462 | $99,412 | $2,910 | $96,502 |
| 2020 | $1,163 | $35,079 | $2,910 | $32,169 |
| 2019 | $1,057 | $32,610 | $2,910 | $29,700 |
| 2018 | $1,039 | $32,610 | $2,910 | $29,700 |
| 2017 | $0 | $32,610 | $2,910 | $29,700 |
| 2016 | $955 | $32,610 | $2,910 | $29,700 |
| 2015 | -- | $32,610 | $2,910 | $29,700 |
| 2014 | -- | $36,220 | $2,910 | $33,310 |
Source: Public Records
Map
Nearby Homes