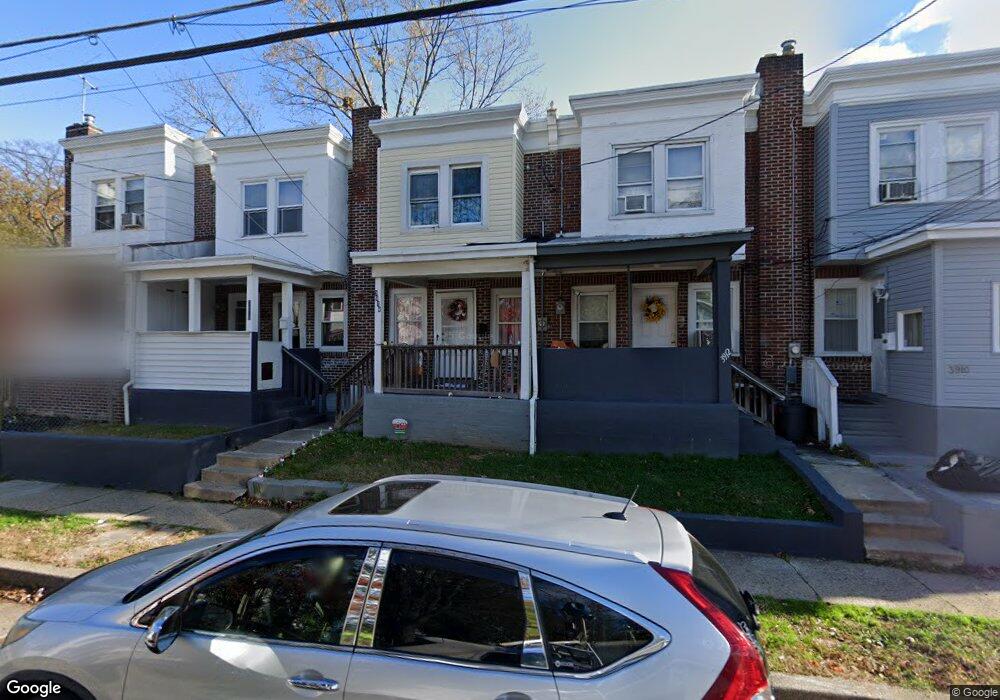
3914 Camden Ave Pennsauken, NJ 08110
Estimated Value: $201,304 - $231,000
3
Beds
2
Baths
920
Sq Ft
$240/Sq Ft
Est. Value
About This Home
This home is located at 3914 Camden Ave, Pennsauken, NJ 08110 and is currently estimated at $220,826, approximately $240 per square foot. 3914 Camden Ave is a home located in Camden County with nearby schools including Pennsauken High School, St. Cecilia School, and Camden Forward School.
Ownership History
Date
Name
Owned For
Owner Type
Purchase Details
Closed on
Dec 1, 2010
Sold by
Pennsauken Housing Authority
Bought by
Pham Hoang and Bui Thuy
Current Estimated Value
Purchase Details
Closed on
May 15, 2000
Sold by
Federal Housing Administration
Bought by
Pennsauken Housing Authority
Purchase Details
Closed on
Dec 31, 1996
Sold by
Fink Marian H
Bought by
Goffney Tawona L
Home Financials for this Owner
Home Financials are based on the most recent Mortgage that was taken out on this home.
Original Mortgage
$12,000
Interest Rate
7.68%
Create a Home Valuation Report for This Property
The Home Valuation Report is an in-depth analysis detailing your home's value as well as a comparison with similar homes in the area
Home Values in the Area
Average Home Value in this Area
Purchase History
| Date | Buyer | Sale Price | Title Company |
|---|---|---|---|
| Pham Hoang | $17,300 | -- | |
| Pennsauken Housing Authority | $24,500 | -- | |
| Pennsauken Housing Authority | $24,500 | -- | |
| Goffney Tawona L | $25,000 | -- |
Source: Public Records
Mortgage History
| Date | Status | Borrower | Loan Amount |
|---|---|---|---|
| Previous Owner | Goffney Tawona L | $12,000 |
Source: Public Records
Tax History Compared to Growth
Tax History
| Year | Tax Paid | Tax Assessment Tax Assessment Total Assessment is a certain percentage of the fair market value that is determined by local assessors to be the total taxable value of land and additions on the property. | Land | Improvement |
|---|---|---|---|---|
| 2025 | $3,081 | $171,600 | $40,500 | $131,100 |
| 2024 | $3,022 | $70,800 | $15,000 | $55,800 |
| 2023 | $3,022 | $70,800 | $15,000 | $55,800 |
| 2022 | $2,732 | $70,800 | $15,000 | $55,800 |
| 2021 | $2,806 | $70,800 | $15,000 | $55,800 |
| 2020 | $2,513 | $70,800 | $15,000 | $55,800 |
| 2019 | $2,542 | $70,800 | $15,000 | $55,800 |
| 2018 | $2,556 | $70,800 | $15,000 | $55,800 |
| 2017 | $1,657 | $70,800 | $15,000 | $55,800 |
| 2016 | $1,627 | $70,800 | $15,000 | $55,800 |
| 2015 | $1,675 | $70,800 | $15,000 | $55,800 |
| 2014 | $1,279 | $44,200 | $10,000 | $34,200 |
Source: Public Records
Map
Nearby Homes