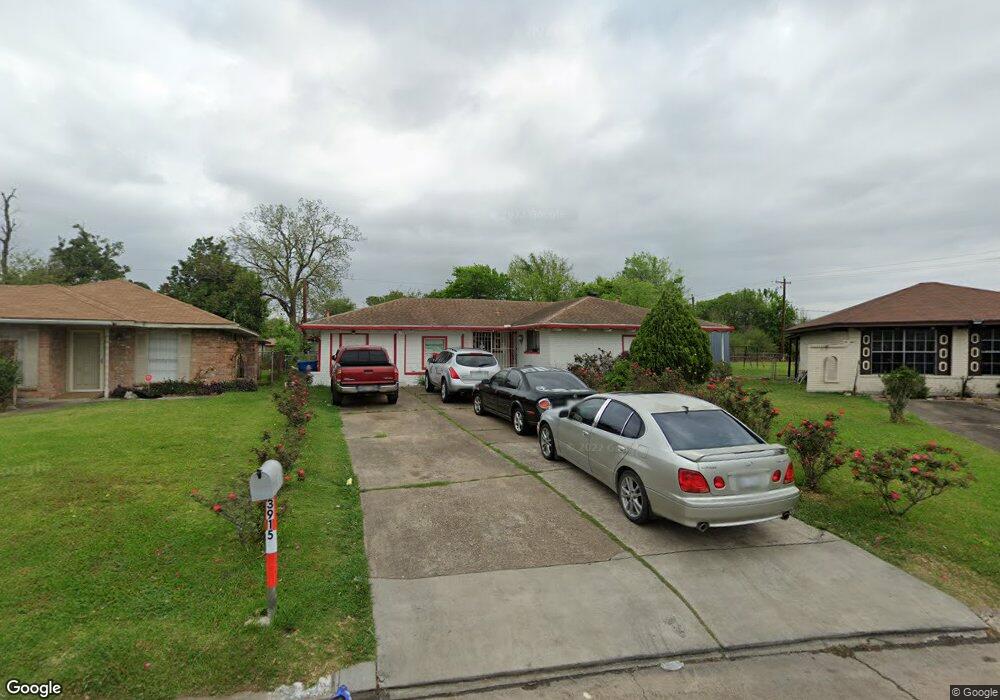
3915 Bethany Ln Houston, TX 77039
East Aldine NeighborhoodEstimated Value: $171,000 - $185,070
3
Beds
2
Baths
990
Sq Ft
$178/Sq Ft
Est. Value
About This Home
This home is located at 3915 Bethany Ln, Houston, TX 77039 and is currently estimated at $175,768, approximately $177 per square foot. 3915 Bethany Ln is a home located in Harris County with nearby schools including Vardeman EC/PK/K, Stephens Elementary School, and Macarthur Ninth Grade School.
Ownership History
Date
Name
Owned For
Owner Type
Purchase Details
Closed on
Mar 25, 2022
Sold by
Eucario Alcozer Jr
Bought by
Alcozer Maria
Current Estimated Value
Purchase Details
Closed on
Aug 28, 2015
Sold by
Rennie Marilyn and Sanchez Marilyn
Bought by
Alcozer Eucario
Home Financials for this Owner
Home Financials are based on the most recent Mortgage that was taken out on this home.
Original Mortgage
$91,483
Interest Rate
4.75%
Mortgage Type
FHA
Purchase Details
Closed on
Jun 2, 2014
Sold by
Rennie Michael E
Bought by
Rennie Marilyn
Purchase Details
Closed on
Aug 29, 1995
Sold by
Burkett Deborah Kay
Bought by
Rennie Michael E and Rennie Marilyn
Home Financials for this Owner
Home Financials are based on the most recent Mortgage that was taken out on this home.
Original Mortgage
$40,700
Interest Rate
7.6%
Mortgage Type
FHA
Purchase Details
Closed on
Aug 28, 1995
Sold by
Burkett Russel Wayne
Bought by
Burkett Deborah Kay
Home Financials for this Owner
Home Financials are based on the most recent Mortgage that was taken out on this home.
Original Mortgage
$40,700
Interest Rate
7.6%
Mortgage Type
FHA
Create a Home Valuation Report for This Property
The Home Valuation Report is an in-depth analysis detailing your home's value as well as a comparison with similar homes in the area
Home Values in the Area
Average Home Value in this Area
Purchase History
| Date | Buyer | Sale Price | Title Company |
|---|---|---|---|
| Alcozer Maria | -- | None Listed On Document | |
| Alcozer Eucario | -- | Capital Title | |
| Rennie Marilyn | -- | None Available | |
| Rennie Michael E | -- | Fidelity National Title | |
| Burkett Deborah Kay | -- | Fidelity National Title |
Source: Public Records
Mortgage History
| Date | Status | Borrower | Loan Amount |
|---|---|---|---|
| Previous Owner | Alcozer Eucario | $91,483 | |
| Previous Owner | Rennie Michael E | $40,700 |
Source: Public Records
Tax History Compared to Growth
Tax History
| Year | Tax Paid | Tax Assessment Tax Assessment Total Assessment is a certain percentage of the fair market value that is determined by local assessors to be the total taxable value of land and additions on the property. | Land | Improvement |
|---|---|---|---|---|
| 2025 | $2,352 | $190,695 | $34,670 | $156,025 |
| 2024 | $2,352 | $187,648 | $34,670 | $152,978 |
| 2023 | $2,352 | $180,445 | $34,670 | $145,775 |
| 2022 | $2,880 | $157,386 | $24,764 | $132,622 |
| 2021 | $2,745 | $142,243 | $24,764 | $117,479 |
| 2020 | $2,630 | $115,761 | $24,764 | $90,997 |
| 2019 | $2,259 | $111,339 | $14,859 | $96,480 |
| 2018 | $881 | $86,335 | $14,859 | $71,476 |
| 2017 | $1,957 | $86,335 | $14,859 | $71,476 |
| 2016 | $1,957 | $86,335 | $14,859 | $71,476 |
| 2015 | $1,061 | $77,013 | $14,859 | $62,154 |
| 2014 | $1,061 | $68,487 | $14,859 | $53,628 |
Source: Public Records
Map
Nearby Homes
- 4002 Charriton Dr
- 3503 Debeney Dr
- 11937 Connor St
- 11769 Gloger St
- 4422 Sandydale Ln
- 12123 Steeple Ln
- 4803 Bethany Ln
- 4801 Marquita Ln
- 0 Lauder Rd
- 4703 Hollybrook Ln
- 4739 Sandydale Ln
- 4522 Collins Rd
- 2710 Woodgate St
- 4705 Lauder Rd
- 4826 Anice St
- 3111 Hartwick Rd
- 2703 Lauder Rd
- 11781 Eastex Fwy
- 9213 Washington St
- 2715 Toyah Ave