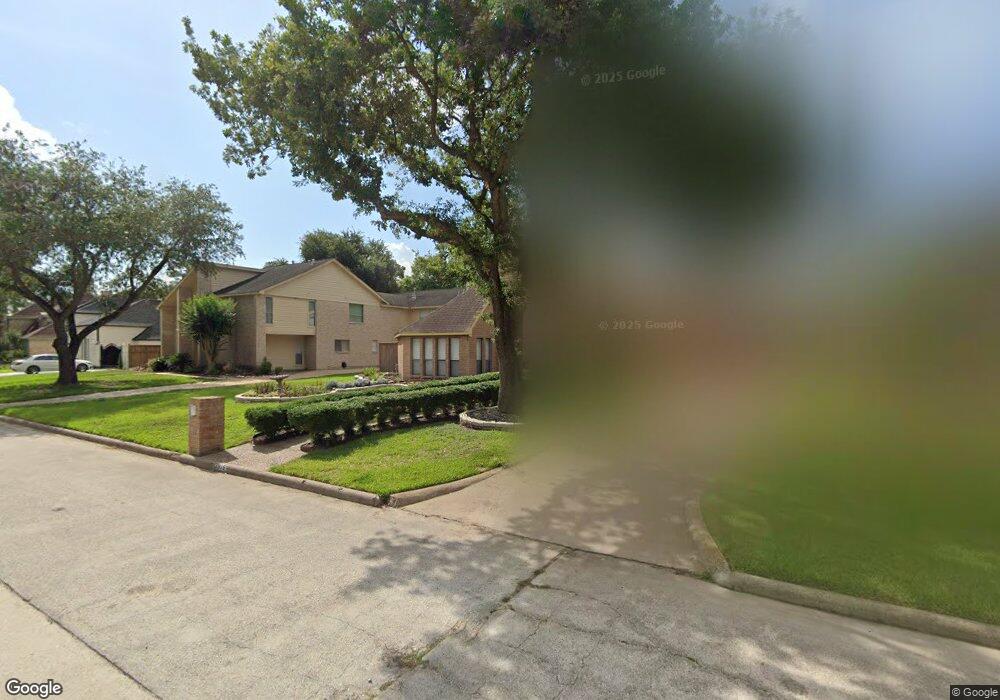
3915 Cherry Forest Dr Houston, TX 77088
Greater Inwood NeighborhoodEstimated Value: $352,385 - $428,000
4
Beds
3
Baths
2,831
Sq Ft
$141/Sq Ft
Est. Value
About This Home
This home is located at 3915 Cherry Forest Dr, Houston, TX 77088 and is currently estimated at $397,846, approximately $140 per square foot. 3915 Cherry Forest Dr is a home located in Harris County with nearby schools including Edward a Vines EC/Pre-K/K School, Harris Elementary School, and Hoffman Middle School.
Ownership History
Date
Name
Owned For
Owner Type
Purchase Details
Closed on
Jun 17, 2005
Sold by
Cummings Claude and Cummings Ruth
Bought by
Cummings Claude
Current Estimated Value
Home Financials for this Owner
Home Financials are based on the most recent Mortgage that was taken out on this home.
Original Mortgage
$160,000
Outstanding Balance
$87,469
Interest Rate
6.5%
Mortgage Type
Fannie Mae Freddie Mac
Estimated Equity
$310,377
Purchase Details
Closed on
May 15, 1996
Sold by
Dixon James Wallace Edwin
Bought by
Cummings Claude and Cummings Ruth
Home Financials for this Owner
Home Financials are based on the most recent Mortgage that was taken out on this home.
Original Mortgage
$89,600
Interest Rate
8.06%
Create a Home Valuation Report for This Property
The Home Valuation Report is an in-depth analysis detailing your home's value as well as a comparison with similar homes in the area
Home Values in the Area
Average Home Value in this Area
Purchase History
| Date | Buyer | Sale Price | Title Company |
|---|---|---|---|
| Cummings Claude | -- | American Title Co | |
| Cummings Claude | -- | -- |
Source: Public Records
Mortgage History
| Date | Status | Borrower | Loan Amount |
|---|---|---|---|
| Open | Cummings Claude | $160,000 | |
| Previous Owner | Cummings Claude | $89,600 | |
| Closed | Cummings Claude | $25,600 | |
| Closed | Cummings Claude | $40,000 |
Source: Public Records
Tax History Compared to Growth
Tax History
| Year | Tax Paid | Tax Assessment Tax Assessment Total Assessment is a certain percentage of the fair market value that is determined by local assessors to be the total taxable value of land and additions on the property. | Land | Improvement |
|---|---|---|---|---|
| 2025 | $6,875 | $358,604 | $80,250 | $278,354 |
| 2024 | $6,875 | $302,927 | $80,250 | $222,677 |
| 2023 | $6,875 | $275,588 | $80,250 | $195,338 |
| 2022 | $6,398 | $266,750 | $80,250 | $186,500 |
| 2021 | $5,505 | $219,167 | $50,156 | $169,011 |
| 2020 | $6,196 | $234,746 | $43,335 | $191,411 |
| 2019 | $6,337 | $228,996 | $43,335 | $185,661 |
| 2018 | $3,859 | $268,748 | $43,335 | $225,413 |
| 2017 | $7,129 | $268,748 | $43,335 | $225,413 |
| 2016 | $6,295 | $237,281 | $43,335 | $193,946 |
| 2015 | $4,724 | $199,416 | $43,335 | $156,081 |
| 2014 | $4,724 | $177,528 | $43,335 | $134,193 |
Source: Public Records
Map
Nearby Homes
- 7331 Athlone Dr
- 3919 Badger Forest Dr
- 4015 Black Locust Dr
- 3711 Black Locust Dr
- 4206 Saratoga Dr
- 4306 Saratoga Dr
- 7200 T C Jester Blvd Unit 24
- 7611 Athlone Dr
- 3503 Cherry Forest Dr
- 7816 Inwood Grove Ln
- DOVE Plan at Alaia Crossing
- CEDAR Plan at Alaia Crossing
- BOXWOOD Plan at Alaia Crossing
- 7705 Inwood Grove Ln
- 7707 Inwood Grove Ln
- 7610 Alperton Dr
- 7712 Inwood Grove Ln
- 7709 Inwood Hills Ln
- 7716 Inwood Grove Ln
- 7718 Inwood Grove Ln
- 3911 Cherry Forest Dr
- 3919 Cherry Forest Dr
- 3910 Badger Forest Dr
- 3914 Badger Forest Dr
- 3907 Cherry Forest Dr
- 3906 Badger Forest Dr
- 3918 Badger Forest Dr
- 3918 Cherry Forest Dr
- 3910 Cherry Forest Dr
- 3902 Badger Forest Dr
- 3903 Cherry Forest Dr
- 7347 Athlone Dr
- 7343 Athlone Dr
- 3906 Cherry Forest Dr
- 7351 Athlone Dr
- 7339 Athlone Dr
- 3923 Elmcrest Dr
- 3911 Badger Forest Dr
- 3915 Badger Forest Dr
- 3818 Badger Forest Dr