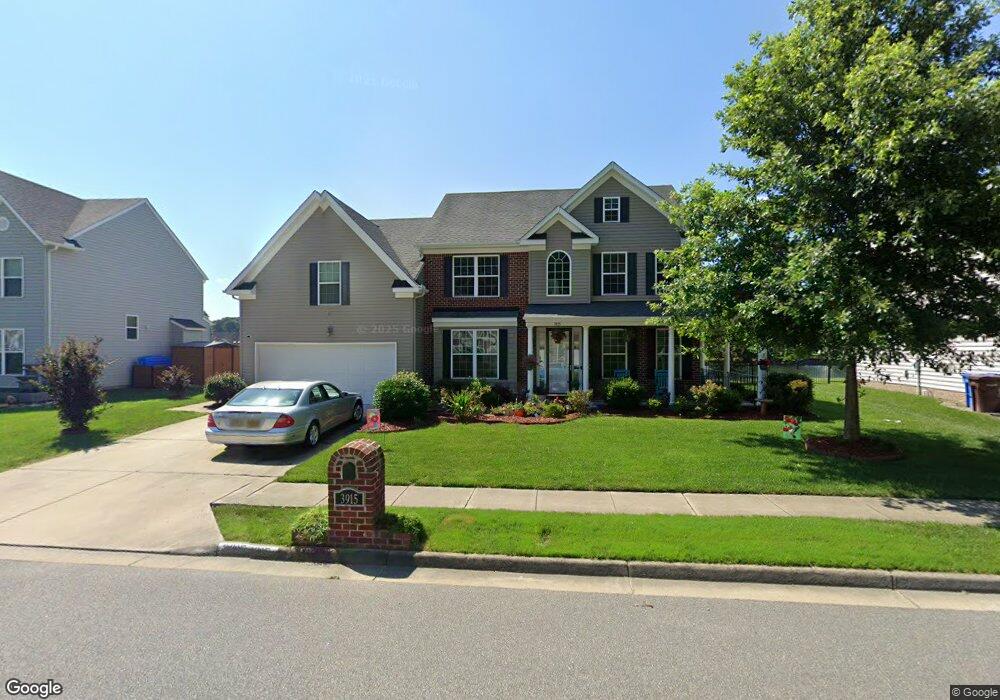
3915 Grand Isle Dr Chesapeake, VA 23323
Western Branch NeighborhoodEstimated Value: $546,000 - $612,000
5
Beds
3
Baths
3,400
Sq Ft
$170/Sq Ft
Est. Value
About This Home
This home is located at 3915 Grand Isle Dr, Chesapeake, VA 23323 and is currently estimated at $577,170, approximately $169 per square foot. 3915 Grand Isle Dr is a home located in Chesapeake City with nearby schools including Southwestern Elementary School, Jolliff Middle School, and Western Branch High School.
Ownership History
Date
Name
Owned For
Owner Type
Purchase Details
Closed on
Oct 12, 2016
Sold by
Robinson-Brown Francisco J and Robinson-Brown Brenda R
Bought by
Jackson Barbara J
Current Estimated Value
Home Financials for this Owner
Home Financials are based on the most recent Mortgage that was taken out on this home.
Original Mortgage
$392,656
Outstanding Balance
$313,886
Interest Rate
3.37%
Mortgage Type
FHA
Estimated Equity
$263,284
Purchase Details
Closed on
Oct 25, 2012
Sold by
Summit Construction Cop
Bought by
Robinson Brown Francisco J
Home Financials for this Owner
Home Financials are based on the most recent Mortgage that was taken out on this home.
Original Mortgage
$404,303
Interest Rate
3.56%
Mortgage Type
VA
Purchase Details
Closed on
Aug 15, 2012
Sold by
Massau V Inc
Bought by
Summit Construction Corp
Create a Home Valuation Report for This Property
The Home Valuation Report is an in-depth analysis detailing your home's value as well as a comparison with similar homes in the area
Home Values in the Area
Average Home Value in this Area
Purchase History
| Date | Buyer | Sale Price | Title Company |
|---|---|---|---|
| Jackson Barbara J | $399,900 | Landmark Title Llc | |
| Robinson Brown Francisco J | $395,794 | -- | |
| Summit Construction Corp | $234,000 | -- |
Source: Public Records
Mortgage History
| Date | Status | Borrower | Loan Amount |
|---|---|---|---|
| Open | Jackson Barbara J | $392,656 | |
| Previous Owner | Robinson Brown Francisco J | $404,303 |
Source: Public Records
Tax History Compared to Growth
Tax History
| Year | Tax Paid | Tax Assessment Tax Assessment Total Assessment is a certain percentage of the fair market value that is determined by local assessors to be the total taxable value of land and additions on the property. | Land | Improvement |
|---|---|---|---|---|
| 2025 | $5,364 | $537,800 | $130,000 | $407,800 |
| 2024 | $5,364 | $531,100 | $130,000 | $401,100 |
| 2023 | $4,976 | $509,500 | $130,000 | $379,500 |
| 2022 | $4,979 | $493,000 | $130,000 | $363,000 |
| 2021 | $4,800 | $457,100 | $120,000 | $337,100 |
| 2020 | $4,239 | $403,700 | $110,000 | $293,700 |
| 2019 | $4,337 | $413,000 | $110,000 | $303,000 |
| 2018 | $4,194 | $394,400 | $105,000 | $289,400 |
| 2017 | $4,141 | $394,400 | $105,000 | $289,400 |
| 2016 | $4,141 | $394,400 | $105,000 | $289,400 |
| 2015 | $4,141 | $394,400 | $105,000 | $289,400 |
| 2014 | $4,024 | $383,200 | $105,000 | $278,200 |
Source: Public Records
Map
Nearby Homes
- 1109 Lakeview Dr
- 1400 Roosevelt Blvd
- 3973 Grand Isle Dr
- 1419 Welcome Rd
- 1404 Cole Rd
- 2 Ross Ct
- 1122 Carrington Crescent S
- 1214 Jamal Ln W
- 1157 Carrington Crescent N
- 4044 River Breeze Cir
- 1207 Darren Dr
- 4109 River Breeze Cir
- 1821 Spar St
- 1212 Nero Dr
- 1136 Horne Ave
- 4004 River Breeze Cir
- 1103 Warfield Dr
- 3721 Bay Crescent
- 1013 Warfield Dr
- 1410 Bardot Ln
- 3913 Grand Isle Dr
- 3917 Grand Isle Dr
- 3914 Grand Isle Dr
- 3919 Grand Isle Dr
- 3911 Grand Isle Dr
- 3916 Grand Isle Dr
- 3912 Grand Isle Dr
- 3920 Grand Isle Dr
- 3909 Grand Isle Dr
- 3921 Grand Isle Dr
- 3908 Grand Isle Dr
- 3923 Grand Isle Dr
- 3922 Grand Isle Dr
- 3907 Grand Isle Dr
- 3906 Grand Isle Dr
- 3905 Grand Isle Dr
- 3904 Grand Isle Dr
- 3927 Grand Isle Dr
- 3903 Grand Isle Dr
- 3936 Lakeview Dr