


$750,000 Pending
- 4 Beds
- 6 Baths
- 3,446 Sq Ft
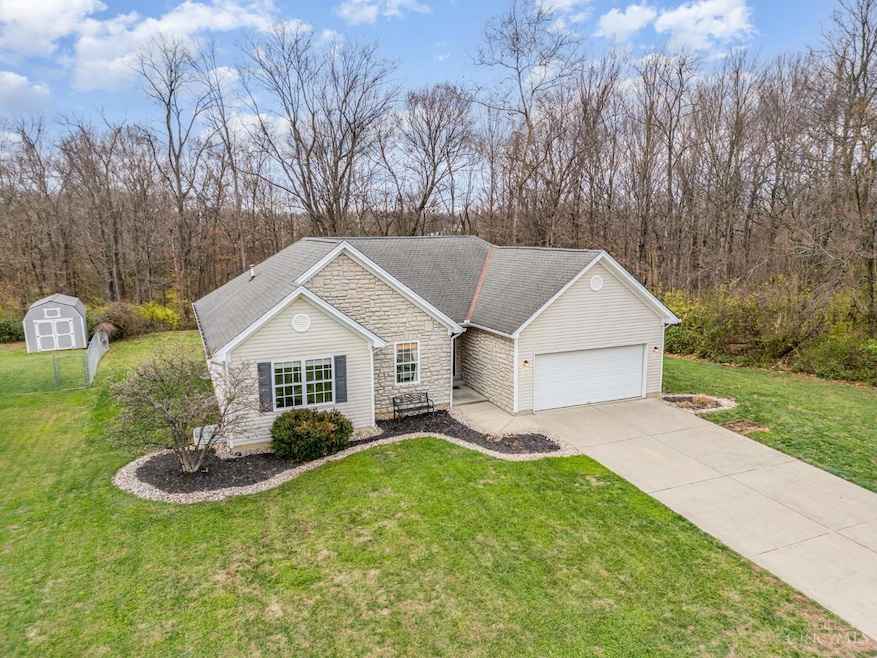
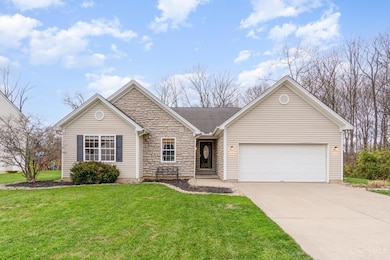
- 933 Country Club Dr
- Cincinnati, OH
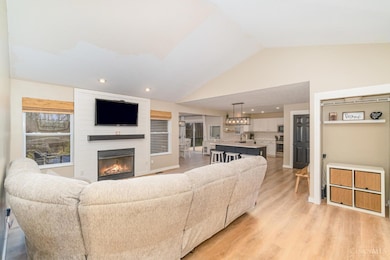
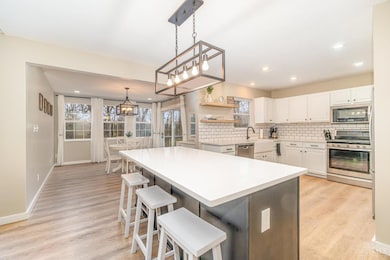
You have found the one! This beautiful home boasts over 4,000 square feet, featuring 4 bedrooms and 6 bathrooms, offering an unparalleled living experience. Features include: An open floor plan with abundant natural light and hardwood floors throughout the main level. The entire home has been updated since 2021, including a new HVAC system and water heater. Outdoor Oasis! Enjoy a new deck with a
Quintin Suggs Pivot Realty Group, LLC