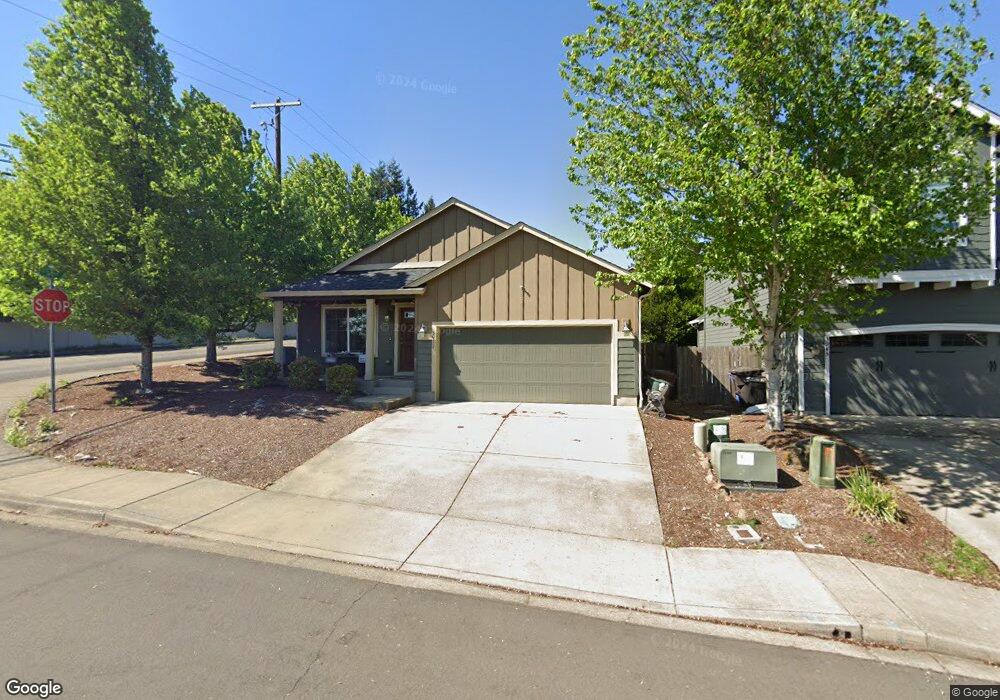
3915 P St Washougal, WA 98671
Estimated Value: $488,523 - $606,000
3
Beds
2
Baths
1,300
Sq Ft
$406/Sq Ft
Est. Value
About This Home
This home is located at 3915 P St, Washougal, WA 98671 and is currently estimated at $528,131, approximately $406 per square foot. 3915 P St is a home located in Clark County with nearby schools including Gause Elementary School, Jemtegaard Middle School, and Washougal High School.
Ownership History
Date
Name
Owned For
Owner Type
Purchase Details
Closed on
Mar 5, 2012
Sold by
Manor Homes Washington Inc
Bought by
Penberthy Babylyn C
Current Estimated Value
Home Financials for this Owner
Home Financials are based on the most recent Mortgage that was taken out on this home.
Original Mortgage
$155,846
Outstanding Balance
$109,723
Interest Rate
4.4%
Mortgage Type
FHA
Estimated Equity
$418,408
Purchase Details
Closed on
Dec 28, 2010
Sold by
West Coast Bank
Bought by
Manor Homes Washington Inc
Purchase Details
Closed on
Aug 19, 2009
Sold by
Boulevard Homes Inc
Bought by
West Coast Bank
Create a Home Valuation Report for This Property
The Home Valuation Report is an in-depth analysis detailing your home's value as well as a comparison with similar homes in the area
Home Values in the Area
Average Home Value in this Area
Purchase History
| Date | Buyer | Sale Price | Title Company |
|---|---|---|---|
| Penberthy Babylyn C | $159,900 | Fidelity National Title | |
| Manor Homes Washington Inc | $754,000 | Cascade Title | |
| West Coast Bank | -- | Clark County Title |
Source: Public Records
Mortgage History
| Date | Status | Borrower | Loan Amount |
|---|---|---|---|
| Open | Penberthy Babylyn C | $155,846 |
Source: Public Records
Tax History Compared to Growth
Tax History
| Year | Tax Paid | Tax Assessment Tax Assessment Total Assessment is a certain percentage of the fair market value that is determined by local assessors to be the total taxable value of land and additions on the property. | Land | Improvement |
|---|---|---|---|---|
| 2025 | $3,901 | $412,366 | $115,000 | $297,366 |
| 2024 | $3,831 | $411,069 | $138,000 | $273,069 |
| 2023 | $3,759 | $422,396 | $148,350 | $274,046 |
| 2022 | $3,744 | $405,889 | $148,350 | $257,539 |
| 2021 | $3,614 | $350,834 | $126,500 | $224,334 |
| 2020 | $3,480 | $317,876 | $115,000 | $202,876 |
| 2019 | $3,071 | $310,938 | $115,000 | $195,938 |
| 2018 | $3,250 | $290,025 | $0 | $0 |
| 2017 | $2,807 | $253,385 | $0 | $0 |
| 2016 | $2,709 | $240,355 | $0 | $0 |
| 2015 | $2,584 | $212,106 | $0 | $0 |
| 2014 | -- | $201,286 | $0 | $0 |
| 2013 | -- | $176,520 | $0 | $0 |
Source: Public Records
Map
Nearby Homes