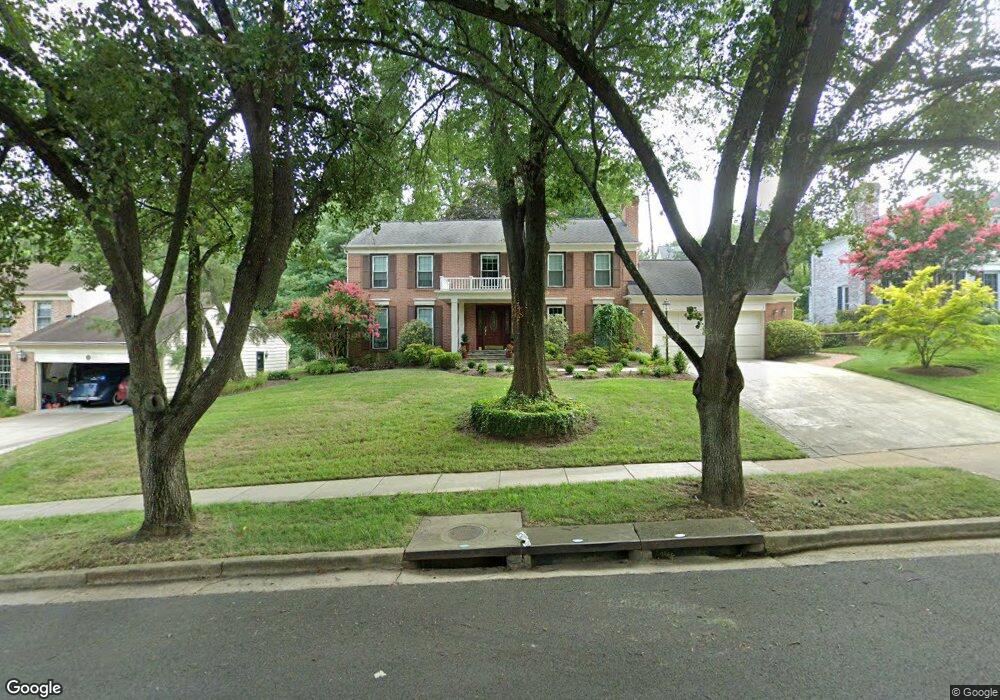
3916 Colonel Ellis Ave Alexandria, VA 22304
Seminary Hill NeighborhoodEstimated Value: $1,355,889 - $1,510,000
4
Beds
4
Baths
2,774
Sq Ft
$522/Sq Ft
Est. Value
About This Home
This home is located at 3916 Colonel Ellis Ave, Alexandria, VA 22304 and is currently estimated at $1,446,963, approximately $521 per square foot. 3916 Colonel Ellis Ave is a home located in Alexandria City with nearby schools including Douglas Macarthur Elementary School, George Washington Middle School, and Alexandria City High School.
Ownership History
Date
Name
Owned For
Owner Type
Purchase Details
Closed on
Jan 13, 2017
Sold by
Georgatos Aspasia P and Georgatos Aspasia Esther P
Bought by
Georgatos Philip C
Current Estimated Value
Purchase Details
Closed on
Nov 8, 1999
Sold by
Kelly Kerry P
Bought by
Georgatos Jerry F
Home Financials for this Owner
Home Financials are based on the most recent Mortgage that was taken out on this home.
Original Mortgage
$240,000
Outstanding Balance
$73,158
Interest Rate
7.73%
Estimated Equity
$1,373,805
Purchase Details
Closed on
May 20, 1996
Sold by
Wannisky William M
Bought by
Kelly Kerry P
Home Financials for this Owner
Home Financials are based on the most recent Mortgage that was taken out on this home.
Original Mortgage
$368,000
Interest Rate
7.77%
Create a Home Valuation Report for This Property
The Home Valuation Report is an in-depth analysis detailing your home's value as well as a comparison with similar homes in the area
Home Values in the Area
Average Home Value in this Area
Purchase History
| Date | Buyer | Sale Price | Title Company |
|---|---|---|---|
| Georgatos Philip C | -- | None Available | |
| Georgatos Jerry F | $495,000 | -- | |
| Kelly Kerry P | $460,000 | -- |
Source: Public Records
Mortgage History
| Date | Status | Borrower | Loan Amount |
|---|---|---|---|
| Open | Georgatos Jerry F | $240,000 | |
| Previous Owner | Kelly Kerry P | $368,000 |
Source: Public Records
Tax History Compared to Growth
Tax History
| Year | Tax Paid | Tax Assessment Tax Assessment Total Assessment is a certain percentage of the fair market value that is determined by local assessors to be the total taxable value of land and additions on the property. | Land | Improvement |
|---|---|---|---|---|
| 2025 | $14,540 | $1,246,549 | $658,000 | $588,549 |
| 2024 | $14,540 | $1,190,444 | $629,000 | $561,444 |
| 2023 | $12,690 | $1,143,212 | $605,000 | $538,212 |
| 2022 | $12,154 | $1,094,923 | $577,000 | $517,923 |
| 2021 | $11,516 | $1,037,458 | $547,000 | $490,458 |
| 2020 | $12,064 | $1,007,435 | $530,400 | $477,035 |
| 2019 | $11,454 | $1,013,629 | $530,400 | $483,229 |
| 2018 | $11,245 | $995,175 | $520,000 | $475,175 |
| 2017 | $10,823 | $957,778 | $495,200 | $462,578 |
| 2016 | $10,823 | $1,008,636 | $521,277 | $487,359 |
| 2015 | $10,280 | $985,661 | $521,277 | $464,384 |
| 2014 | $10,178 | $975,843 | $482,664 | $493,179 |
Source: Public Records
Map
Nearby Homes
- 803 N Howard St Unit 254
- 803 N Howard St Unit 252
- 3409 Sterling Ave
- 132 N Early St
- 3807 Taft Ave
- 318 N Quaker Ln
- 3811 Usher Ct
- 32 Carriage House Cir
- 3816 Usher Ct
- 28 Garden Dr
- 4532 Peacock Ave
- 33 Underwood Place
- 3827 Keller Ave
- 55 Arell Ct
- 3755 Keller Ave
- 1255 Dartmouth Ct
- 1231 Quaker Hill Dr
- 4600 Strathblane Place
- 1201 Dartmouth Rd
- 3823 Jay Ave
- 3920 Colonel Ellis Ave
- 3912 Colonel Ellis Ave
- 3909 Terry Place
- 3913 Terry Place
- 3905 Terry Place
- 3924 Colonel Ellis Ave
- 3908 Colonel Ellis Ave
- 3917 Terry Place
- 3917 Colonel Ellis Ave
- 3921 Colonel Ellis Ave
- 3901 Terry Place
- 3904 Colonel Ellis Ave
- 3928 Colonel Ellis Ave
- 3925 Colonel Ellis Ave
- 3913 Colonel Ellis Ave
- 3916 Terry Place
- 3921 Terry Place
- 3912 Terry Place
- 1000 Hardee Place
- 3929 Colonel Ellis Ave