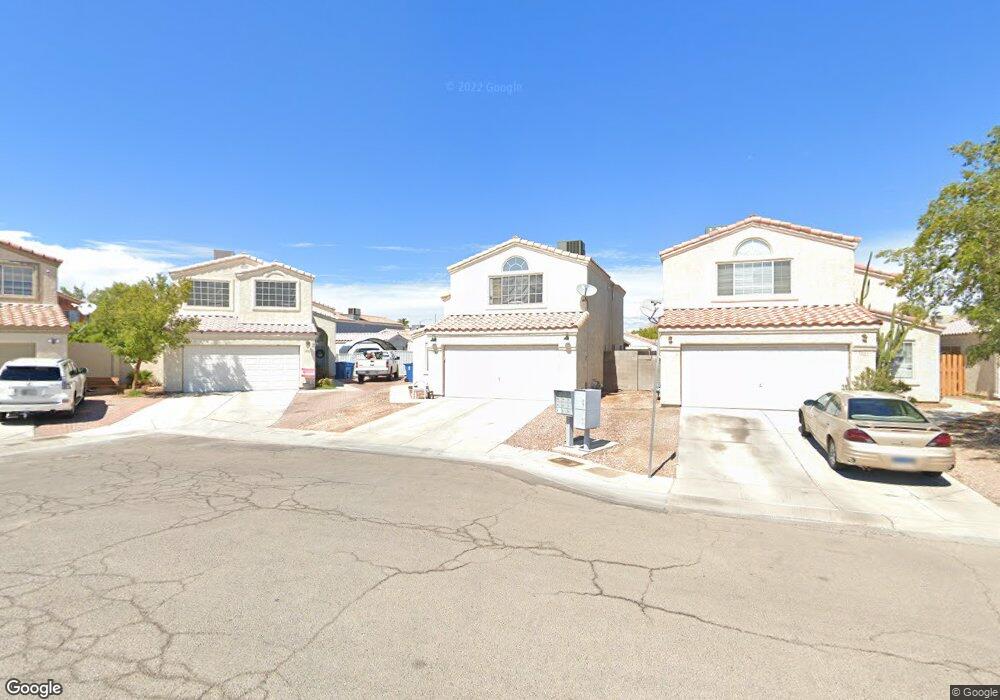
3916 Sir Payne Ct Las Vegas, NV 89104
Estimated Value: $351,149 - $417,000
2
Beds
3
Baths
1,604
Sq Ft
$232/Sq Ft
Est. Value
About This Home
This home is located at 3916 Sir Payne Ct, Las Vegas, NV 89104 and is currently estimated at $372,537, approximately $232 per square foot. 3916 Sir Payne Ct is a home located in Clark County with nearby schools including Walter V. Long Elementary School, Jerome Mack Middle School, and Chaparral High School.
Ownership History
Date
Name
Owned For
Owner Type
Purchase Details
Closed on
Aug 2, 2006
Sold by
Gossen Casey E and Walker Julie D
Bought by
Walker Julie D
Current Estimated Value
Purchase Details
Closed on
Mar 14, 2001
Sold by
Cole George Raymond
Bought by
Gossen Casey E and Walker Julie D
Home Financials for this Owner
Home Financials are based on the most recent Mortgage that was taken out on this home.
Original Mortgage
$128,483
Outstanding Balance
$47,099
Interest Rate
7.11%
Mortgage Type
FHA
Estimated Equity
$325,438
Purchase Details
Closed on
Mar 2, 1995
Sold by
All American Construction Inc
Bought by
Cole George Raymond
Home Financials for this Owner
Home Financials are based on the most recent Mortgage that was taken out on this home.
Original Mortgage
$58,900
Interest Rate
9.09%
Create a Home Valuation Report for This Property
The Home Valuation Report is an in-depth analysis detailing your home's value as well as a comparison with similar homes in the area
Home Values in the Area
Average Home Value in this Area
Purchase History
| Date | Buyer | Sale Price | Title Company |
|---|---|---|---|
| Walker Julie D | $55,000 | None Available | |
| Gossen Casey E | $130,500 | Stewart Title | |
| Cole George Raymond | $109,000 | First American Title Company |
Source: Public Records
Mortgage History
| Date | Status | Borrower | Loan Amount |
|---|---|---|---|
| Open | Gossen Casey E | $128,483 | |
| Previous Owner | Cole George Raymond | $58,900 |
Source: Public Records
Tax History Compared to Growth
Tax History
| Year | Tax Paid | Tax Assessment Tax Assessment Total Assessment is a certain percentage of the fair market value that is determined by local assessors to be the total taxable value of land and additions on the property. | Land | Improvement |
|---|---|---|---|---|
| 2025 | $1,084 | $71,658 | $22,750 | $48,908 |
| 2024 | $1,053 | $71,658 | $22,750 | $48,908 |
| 2023 | $1,053 | $72,213 | $25,550 | $46,663 |
| 2022 | $1,022 | $64,456 | $21,700 | $42,756 |
| 2021 | $993 | $60,758 | $19,950 | $40,808 |
| 2020 | $961 | $59,855 | $19,250 | $40,605 |
| 2019 | $933 | $56,518 | $16,450 | $40,068 |
| 2018 | $906 | $51,027 | $12,600 | $38,427 |
| 2017 | $1,450 | $49,436 | $10,500 | $38,936 |
| 2016 | $859 | $46,372 | $9,100 | $37,272 |
| 2015 | $856 | $37,254 | $7,000 | $30,254 |
| 2014 | $829 | $27,433 | $5,250 | $22,183 |
Source: Public Records
Map
Nearby Homes
- 1944 Randa Ln
- 2356 Grannis Ln
- 4055 E New York Ave
- 4170 E Baltimore Ave
- 4120 E Cincinnati Ave
- 2278 Miner Way
- 1892 Miner Way
- 4214 E Baltimore Ave
- 3887 Delling Ct
- 1601 S Sandhill Rd Unit 78
- 1601 S Sandhill Rd Unit 191
- 2038 Palm St Unit 407
- 2038 Palm St Unit 60
- 2038 Palm St Unit 427
- 2038 Palm St Unit 321
- 2038 Palm St Unit 298
- 2038 Palm St Unit 47
- 2038 Palm St Unit 81
- 2038 Palm St Unit 169
- 2038 Palm St Unit 98
- 3922 Sir Payne Ct
- 3910 Sir Payne Ct
- 3928 Sir Payne Ct
- 3915 Captain Jon Ave
- 3909 Captain Jon Ave
- 3904 Sir Payne Ct
- 3921 Captain Jon Ave
- 3903 Captain Jon Ave
- 3927 Captain Jon Ave
- 3897 Captain Jon Ave
- 3933 Captain Jon Ave
- 3921 Sir Payne Ct
- 3940 Sir Payne Ct
- 3915 Sir Payne Ct
- 3909 Sir Payne Ct
- 2158 Saint Paul Way
- 3927 Sir Payne Ct
- 2168 Saint Paul Way
- 2148 Saint Paul Way