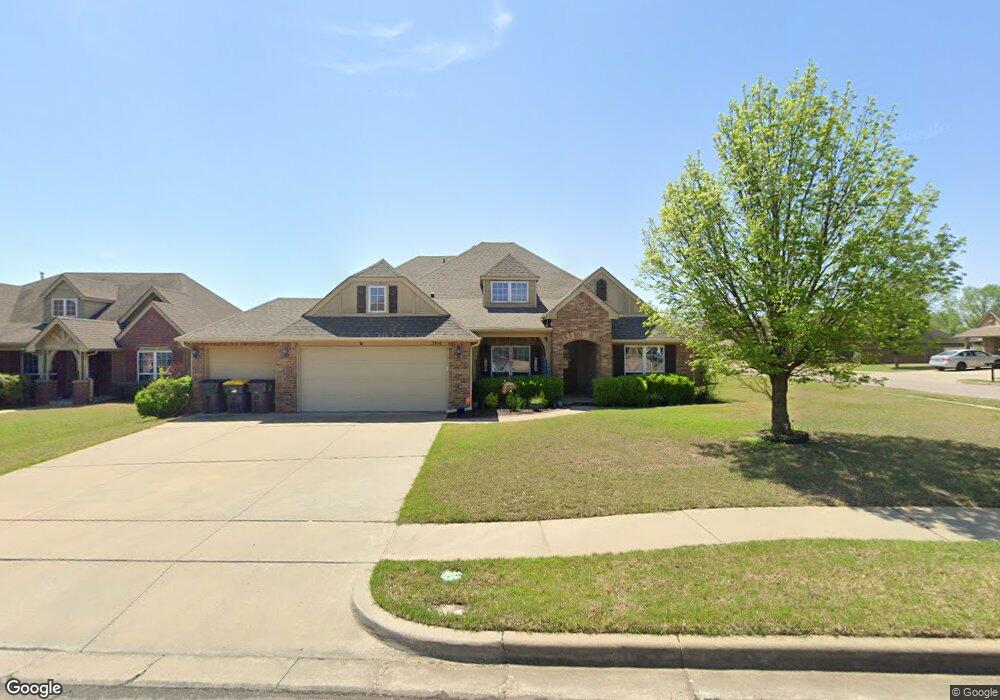
3916 W 109th St S Sapulpa, OK 74066
Estimated Value: $429,203 - $450,000
--
Bed
3
Baths
2,906
Sq Ft
$151/Sq Ft
Est. Value
About This Home
This home is located at 3916 W 109th St S, Sapulpa, OK 74066 and is currently estimated at $437,801, approximately $150 per square foot. 3916 W 109th St S is a home located in Tulsa County with nearby schools including Jenks West Elementary School, Jenks West Intermediate Elementary School, and Jenks Middle School.
Ownership History
Date
Name
Owned For
Owner Type
Purchase Details
Closed on
Sep 23, 2016
Bought by
Roybal Jospeh
Current Estimated Value
Home Financials for this Owner
Home Financials are based on the most recent Mortgage that was taken out on this home.
Original Mortgage
$272,473
Outstanding Balance
$217,990
Interest Rate
3.48%
Estimated Equity
$219,811
Purchase Details
Closed on
Jul 15, 2010
Sold by
Zepf Peter A and Zepf Brittany M
Bought by
Zepf Peter A and Zepf Alfonse W
Home Financials for this Owner
Home Financials are based on the most recent Mortgage that was taken out on this home.
Original Mortgage
$273,007
Interest Rate
4.73%
Mortgage Type
FHA
Purchase Details
Closed on
Dec 1, 2008
Sold by
Simmons Homes Residential Group Llc
Bought by
Zepf Peter A and Zepf Brittany M
Home Financials for this Owner
Home Financials are based on the most recent Mortgage that was taken out on this home.
Original Mortgage
$260,798
Interest Rate
6.48%
Mortgage Type
FHA
Create a Home Valuation Report for This Property
The Home Valuation Report is an in-depth analysis detailing your home's value as well as a comparison with similar homes in the area
Home Values in the Area
Average Home Value in this Area
Purchase History
| Date | Buyer | Sale Price | Title Company |
|---|---|---|---|
| Roybal Jospeh | -- | -- | |
| Zepf Peter A | -- | Executives Title & Escrow Co | |
| Zepf Peter A | $266,000 | Executives Title & Escrow Co |
Source: Public Records
Mortgage History
| Date | Status | Borrower | Loan Amount |
|---|---|---|---|
| Open | Roybal Jospeh | $272,473 | |
| Closed | Roybal Jospeh | -- | |
| Previous Owner | Zepf Peter A | $273,007 | |
| Previous Owner | Zepf Peter A | $260,798 |
Source: Public Records
Tax History Compared to Growth
Tax History
| Year | Tax Paid | Tax Assessment Tax Assessment Total Assessment is a certain percentage of the fair market value that is determined by local assessors to be the total taxable value of land and additions on the property. | Land | Improvement |
|---|---|---|---|---|
| 2024 | $4,285 | $35,337 | $3,757 | $31,580 |
| 2023 | $4,285 | $33,653 | $3,804 | $29,849 |
| 2022 | $4,120 | $32,051 | $4,620 | $27,431 |
| 2021 | $3,975 | $30,525 | $4,400 | $26,125 |
| 2020 | $3,887 | $30,525 | $4,400 | $26,125 |
| 2019 | $3,914 | $30,525 | $4,400 | $26,125 |
| 2018 | $3,940 | $30,525 | $4,400 | $26,125 |
| 2017 | $3,876 | $30,525 | $4,400 | $26,125 |
| 2016 | $3,742 | $29,260 | $4,400 | $24,860 |
| 2015 | $3,813 | $29,260 | $4,400 | $24,860 |
| 2014 | $3,899 | $29,260 | $4,400 | $24,860 |
Source: Public Records
Map
Nearby Homes
- 10910 S Olmsted St
- 3710 W 110th St S
- 3706 W 106th St S
- 10732 S 33rd West Ave
- 10417 S 33rd West Ave
- 11602 S 30th West Ave
- 10317 S Nathan St
- 11608 S Union Ave
- 2957 W 114th Place S
- 11275 S Douglas Ave
- 11009 Augusta Dr
- 10739 Masters Cir
- 2629 W 115th St S
- 11710 S Willow Place
- 11728 S Willow Place
- 0 Lakeside Dr
- 2012 W 109th St S
- 4367 Lakeside Dr
- 11206 S Redbud St
- 9435 S 33rd West Ave
- 3914 W 109th St S
- 3912 W 109th St S
- 3904 W 109th St S
- 3910 W 109th St S
- 3908 W 109th St S
- 3915 W 109th St S
- 3911 W 109th St S
- 3909 W 109th St S
- 3905 W 109th St S
- 3906 W 109th St S
- 3913 W 109th St S
- 3907 W 109th St S
- 3913 W 110th St S
- 3907 W 110th St S
- 3914 W 108th St S
- 3903 W 109th St S
- 3905 W 110th St S
- 10906 S Olmsted St
- 10910 S Olmsted St
- 3915 W 110th St S