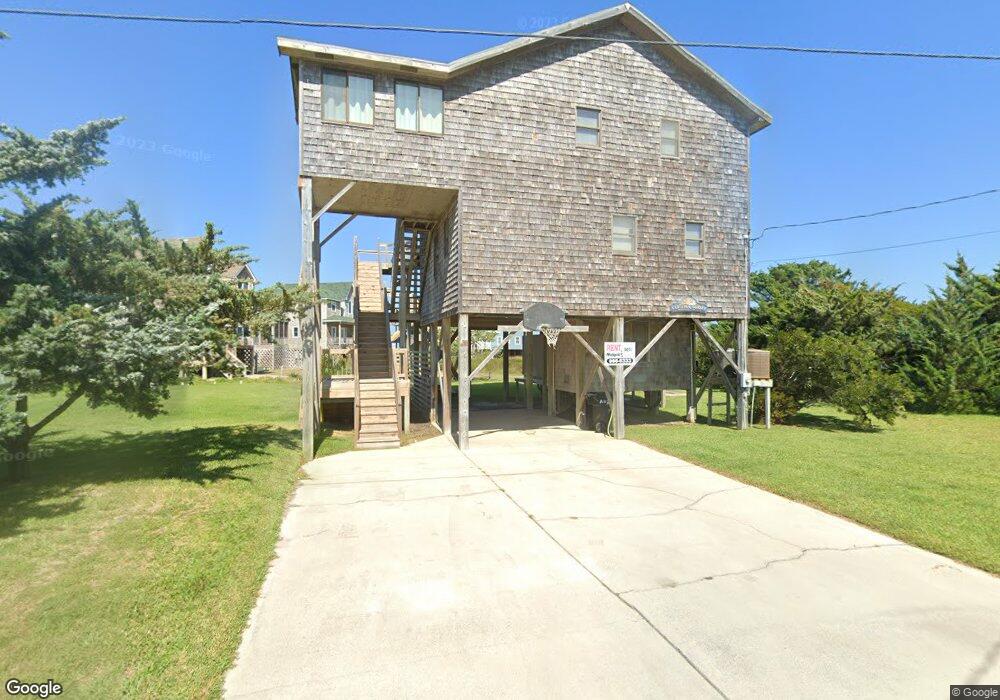
39165 Weakfish Rd Avon, NC 27915
Estimated Value: $429,000 - $522,000
3
Beds
3
Baths
1,544
Sq Ft
$313/Sq Ft
Est. Value
About This Home
This home is located at 39165 Weakfish Rd, Avon, NC 27915 and is currently estimated at $482,625, approximately $312 per square foot. 39165 Weakfish Rd is a home located in Dare County with nearby schools including Cape Hatteras Elementary School and Cape Hatteras Secondary School.
Ownership History
Date
Name
Owned For
Owner Type
Purchase Details
Closed on
Nov 21, 2022
Sold by
Kramer Nicole C and Kramer Jason A
Bought by
Weakfish Trust
Current Estimated Value
Purchase Details
Closed on
Sep 18, 2020
Sold by
Barnes Dawn C and Barnes Hal W
Bought by
Kramer Nicole C and Kramer Jason A
Home Financials for this Owner
Home Financials are based on the most recent Mortgage that was taken out on this home.
Original Mortgage
$226,400
Interest Rate
2.9%
Mortgage Type
New Conventional
Purchase Details
Closed on
Jan 8, 2010
Sold by
Barnes Dawn C
Bought by
Barnes Dawn C and Barnes Hal W
Purchase Details
Closed on
May 20, 2005
Sold by
Perkey Gilbert J and Perkey Christine M
Bought by
Barnes Dawn C
Home Financials for this Owner
Home Financials are based on the most recent Mortgage that was taken out on this home.
Original Mortgage
$41,000
Interest Rate
5.88%
Mortgage Type
Purchase Money Mortgage
Create a Home Valuation Report for This Property
The Home Valuation Report is an in-depth analysis detailing your home's value as well as a comparison with similar homes in the area
Home Values in the Area
Average Home Value in this Area
Purchase History
| Date | Buyer | Sale Price | Title Company |
|---|---|---|---|
| Weakfish Trust | -- | -- | |
| Kramer Nicole C | $283,000 | None Available | |
| Barnes Dawn C | -- | None Available | |
| Barnes Dawn C | $410,000 | None Available |
Source: Public Records
Mortgage History
| Date | Status | Borrower | Loan Amount |
|---|---|---|---|
| Previous Owner | Kramer Nicole C | $226,400 | |
| Previous Owner | Barnes Dawn C | $41,000 |
Source: Public Records
Tax History
| Year | Tax Paid | Tax Assessment Tax Assessment Total Assessment is a certain percentage of the fair market value that is determined by local assessors to be the total taxable value of land and additions on the property. | Land | Improvement |
|---|---|---|---|---|
| 2025 | $2,143 | $482,700 | $92,800 | $389,900 |
| 2024 | $1,879 | $290,200 | $76,800 | $213,400 |
| 2023 | $1,162 | $298,736 | $76,800 | $221,936 |
| 2022 | $1,849 | $298,736 | $76,800 | $221,936 |
| 2021 | $1,820 | $298,736 | $76,800 | $221,936 |
| 2020 | $1,666 | $298,736 | $76,800 | $221,936 |
| 2019 | $1,376 | $205,300 | $70,300 | $135,000 |
| 2018 | $1,376 | $205,300 | $70,300 | $135,000 |
| 2017 | $1,376 | $205,300 | $70,300 | $135,000 |
| 2016 | $1,292 | $205,300 | $70,300 | $135,000 |
| 2014 | $1,292 | $205,300 | $70,300 | $135,000 |
Source: Public Records
Map
Nearby Homes
- 39006 Drum Rd Unit Lot216
- 39189 A N Albacore Ln Unit Lot 205
- 39203 Island Creek Dr Unit 8-1
- 39009 Snook Ct Unit Lot 127
- 39255 Hatteras Ln Unit Lot 32
- 39194 W Sunfish Ct Unit Lot 137
- 39000 Bluefish Ct Unit Lot 193
- 39204 Tarpon Dr Unit Lot 109
- 39227 Pompano Dr Unit Lot 105
- 39916 Nc 12 Hwy Unit Lot 23
- 39321 Tarpon Dr Unit Lot: 17
- 0 Island Unit LotBigIsland
- 40238 Ellwood Ct Unit 36
- 40008 N End Rd
- 40232 Ellwood Ct Unit Lot 46
- 40036 N End Rd
- 40145 N End Rd
- 40377 N Beachcomber Dr Unit Lot 62
- 40250 Dolphin Ln Unit Lot 82
- 40185 Leslie Ln Unit Lot 7
- 39165 Weakfish Dr
- 39166 Weakfish Rd Unit 237
- 39166 Weakfish Dr
- 39038 Windy Ln
- 39168 Weakfish Dr
- 39173 Weakfish Dr
- 39162 Weakfish Dr
- 39034 Windy Ln
- 39159 Weakfish Dr
- 39160 Weakfish Rd
- 39172 Weakfish Rd
- 39172 Weakfish Dr Unit Lot 235
- 39172 Weakfish Dr
- 39020 Windy Ln
- 39174 Weakfish Rd
- 39179 Weakfish Rd
- 39158 Weakfish Dr
- 39001 Drum Rd
- 39002 Drum Rd
- 39157 Weakfish Dr
Your Personal Tour Guide
Ask me questions while you tour the home.