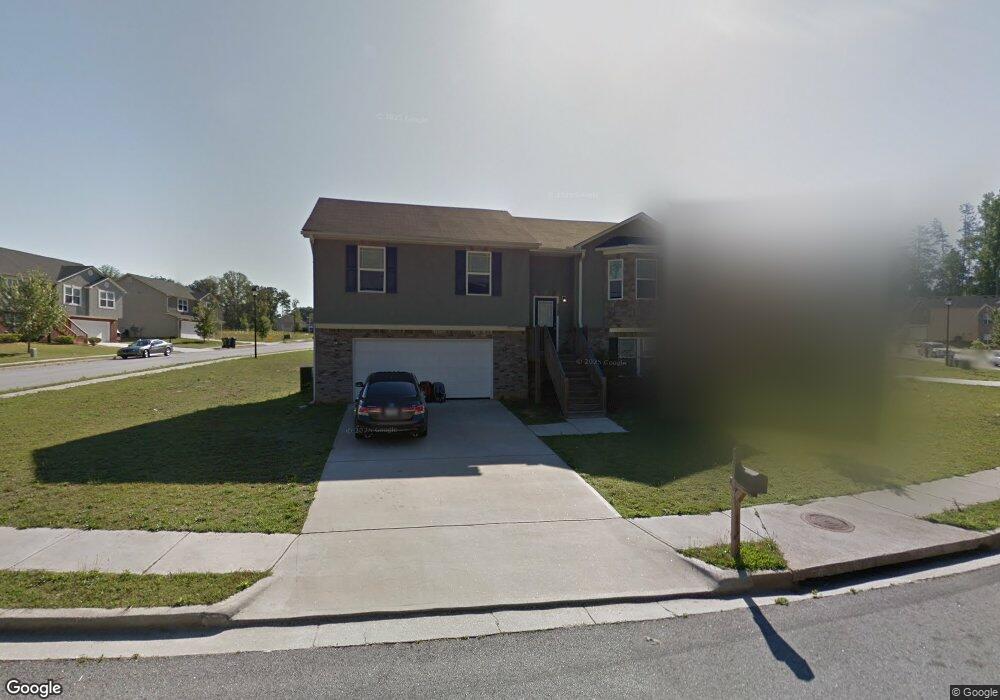
3917 Alderwoods Dr Unit 53 Jonesboro, GA 30236
Estimated Value: $233,666 - $247,000
4
Beds
3
Baths
2,104
Sq Ft
$115/Sq Ft
Est. Value
About This Home
This home is located at 3917 Alderwoods Dr Unit 53, Jonesboro, GA 30236 and is currently estimated at $241,417, approximately $114 per square foot. 3917 Alderwoods Dr Unit 53 is a home located in Clayton County with nearby schools including Harper Elementary School, Sequoyah Middle School, and Charles R. Drew High School.
Ownership History
Date
Name
Owned For
Owner Type
Purchase Details
Closed on
May 3, 2019
Sold by
Kyles Shaun
Bought by
Jackson Autumn L
Current Estimated Value
Home Financials for this Owner
Home Financials are based on the most recent Mortgage that was taken out on this home.
Original Mortgage
$140,650
Outstanding Balance
$123,155
Interest Rate
4%
Mortgage Type
New Conventional
Estimated Equity
$118,262
Purchase Details
Closed on
Dec 20, 2013
Sold by
Kyles Shaun
Bought by
Kyles Shaun and Kyles Courtney Lucky
Home Financials for this Owner
Home Financials are based on the most recent Mortgage that was taken out on this home.
Original Mortgage
$88,369
Interest Rate
4.25%
Mortgage Type
FHA
Purchase Details
Closed on
Oct 2, 2012
Sold by
Divine Flow Llc
Bought by
Res Ga Eleven Llc
Purchase Details
Closed on
Jan 6, 2009
Sold by
Clay Robertson Inc
Bought by
Firstcity Bank
Create a Home Valuation Report for This Property
The Home Valuation Report is an in-depth analysis detailing your home's value as well as a comparison with similar homes in the area
Home Values in the Area
Average Home Value in this Area
Purchase History
| Date | Buyer | Sale Price | Title Company |
|---|---|---|---|
| Jackson Autumn L | $145,000 | -- | |
| Kyles Shaun | -- | -- | |
| Kyles Shaun | $90,000 | -- | |
| Res Ga Eleven Llc | $115,000 | -- | |
| Firstcity Bank | $112,492 | -- | |
| Firstcity Bank | $108,261 | -- |
Source: Public Records
Mortgage History
| Date | Status | Borrower | Loan Amount |
|---|---|---|---|
| Open | Jackson Autumn L | $140,650 | |
| Previous Owner | Kyles Shaun | $88,369 |
Source: Public Records
Tax History Compared to Growth
Tax History
| Year | Tax Paid | Tax Assessment Tax Assessment Total Assessment is a certain percentage of the fair market value that is determined by local assessors to be the total taxable value of land and additions on the property. | Land | Improvement |
|---|---|---|---|---|
| 2024 | $3,075 | $87,840 | $8,000 | $79,840 |
| 2023 | $2,445 | $67,720 | $8,000 | $59,720 |
| 2022 | $2,608 | $65,480 | $8,000 | $57,480 |
| 2021 | $2,569 | $64,080 | $8,000 | $56,080 |
| 2020 | $2,299 | $56,522 | $8,000 | $48,522 |
| 2019 | $1,894 | $55,722 | $7,200 | $48,522 |
| 2018 | $1,544 | $47,107 | $7,200 | $39,907 |
| 2017 | $1,190 | $38,311 | $7,200 | $31,111 |
| 2016 | $1,246 | $39,697 | $7,200 | $32,497 |
| 2015 | $1,035 | $0 | $0 | $0 |
| 2014 | $962 | $33,213 | $7,200 | $26,013 |
Source: Public Records
Map
Nearby Homes
- 378 Durmire Dr
- 3942 Alderwoods Dr
- 3938 Alderwoods Dr
- 439 River Rd
- 200 Sunrise Cir
- 6673 Brookwood Cir
- 123 Oldenburg Dr
- 90 Jonathan Rd
- 371 Roxbury Dr
- 6764 Brookwood Cir
- 7114 Lady Heidi Ct
- 7118 Lady Heidi Ct
- 653 Georgetown Ln
- 514 Arrowhead Blvd
- 410 Queen Aliese Ln Unit 1
- 680 Sherwood Dr
- 694 Georgetown Ct
- 699 Georgetown Ct
- 702 Georgetown Ct
- 705 Georgetown Ln
- 3917 Alderwoods Dr
- 3909 Alderwoods Dr
- 347 Durmire Dr
- 3929 Alderwoods Dr
- 3901 Alderwoods Dr
- 3930 Alderwoods Dr
- 3934 Alderwoods Dr
- 346 Durmire Dr
- 353 Durmire Dr
- 3924 Alderwoods Dr
- 3935 Alderwoods Dr
- 3893 Alderwoods Dr
- 350 Durmire Dr
- 3918 Alderwoods Dr
- 3910 Alderwoods Dr
- 359 Durmire Dr
- 3853 Cochran Ct Unit /69
- 3853 Cochran Ct
- 3887 Alderwoods Dr
- 3943 Alderwoods Dr