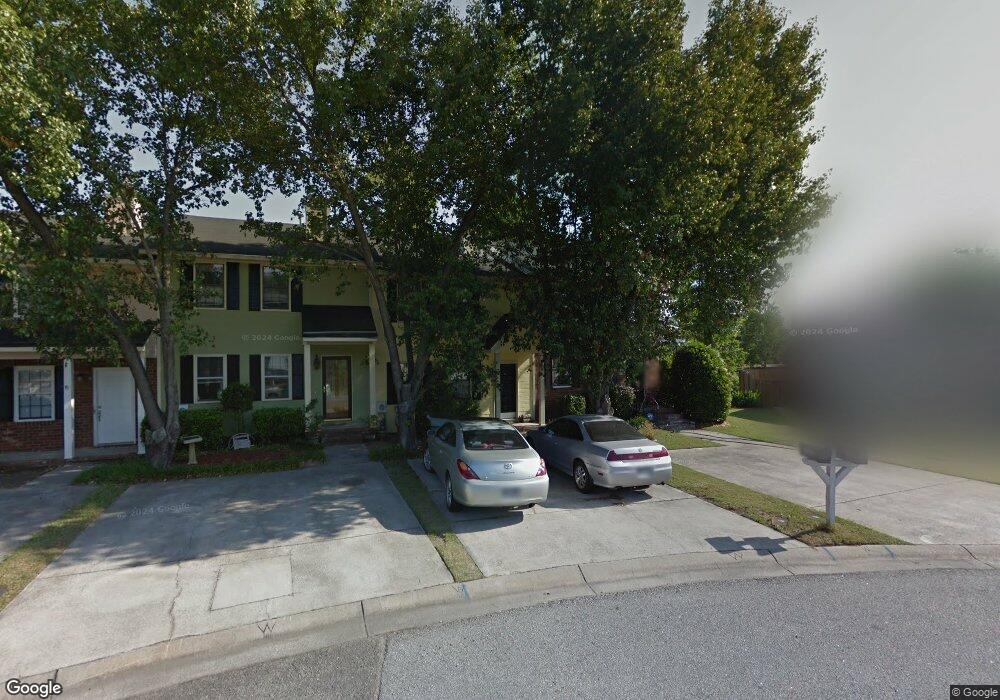
3917 Miramar Drive Extension Augusta, GA 30907
Estimated Value: $176,123 - $208,000
2
Beds
3
Baths
1,301
Sq Ft
$147/Sq Ft
Est. Value
About This Home
This home is located at 3917 Miramar Drive Extension, Augusta, GA 30907 and is currently estimated at $191,281, approximately $147 per square foot. 3917 Miramar Drive Extension is a home located in Columbia County with nearby schools including Northmore Elementary School, Jupiter Elementary School, and Martinez Elementary School.
Ownership History
Date
Name
Owned For
Owner Type
Purchase Details
Closed on
May 12, 2006
Sold by
Allen Donald L
Bought by
Hardy Owen T
Current Estimated Value
Home Financials for this Owner
Home Financials are based on the most recent Mortgage that was taken out on this home.
Original Mortgage
$77,647
Outstanding Balance
$44,750
Interest Rate
6.41%
Mortgage Type
FHA
Estimated Equity
$146,531
Purchase Details
Closed on
Nov 8, 2005
Sold by
David A Dunn Construction
Bought by
Dunn Christina L
Home Financials for this Owner
Home Financials are based on the most recent Mortgage that was taken out on this home.
Original Mortgage
$45,620
Interest Rate
5.84%
Mortgage Type
New Conventional
Purchase Details
Closed on
Oct 31, 2005
Sold by
Dunn Christina L
Bought by
Allen Donald L and Allen Belle L
Home Financials for this Owner
Home Financials are based on the most recent Mortgage that was taken out on this home.
Original Mortgage
$45,620
Interest Rate
5.84%
Mortgage Type
New Conventional
Create a Home Valuation Report for This Property
The Home Valuation Report is an in-depth analysis detailing your home's value as well as a comparison with similar homes in the area
Home Values in the Area
Average Home Value in this Area
Purchase History
| Date | Buyer | Sale Price | Title Company |
|---|---|---|---|
| Hardy Owen T | $78,900 | -- | |
| Dunn Christina L | -- | -- | |
| Allen Donald L | $50,689 | -- |
Source: Public Records
Mortgage History
| Date | Status | Borrower | Loan Amount |
|---|---|---|---|
| Open | Hardy Owen T | $77,647 | |
| Previous Owner | Allen Donald L | $45,620 |
Source: Public Records
Tax History Compared to Growth
Tax History
| Year | Tax Paid | Tax Assessment Tax Assessment Total Assessment is a certain percentage of the fair market value that is determined by local assessors to be the total taxable value of land and additions on the property. | Land | Improvement |
|---|---|---|---|---|
| 2025 | $1,549 | $62,472 | $14,404 | $48,068 |
| 2024 | $1,574 | $60,647 | $12,304 | $48,343 |
| 2023 | $1,574 | $55,543 | $12,304 | $43,239 |
| 2022 | $1,417 | $52,260 | $10,204 | $42,056 |
| 2021 | $1,287 | $45,154 | $8,704 | $36,450 |
| 2020 | $1,223 | $41,901 | $8,904 | $32,997 |
| 2019 | $1,079 | $36,727 | $7,804 | $28,923 |
| 2018 | $1,058 | $35,850 | $7,504 | $28,346 |
| 2017 | $1,047 | $35,333 | $7,104 | $28,229 |
| 2016 | $949 | $33,006 | $6,780 | $26,226 |
| 2015 | $994 | $34,601 | $6,780 | $27,821 |
| 2014 | $955 | $32,750 | $6,980 | $25,770 |
Source: Public Records
Map
Nearby Homes
- 3921 Miramar Drive Extension
- 255 Settlement Rd
- 3973 Concord Place
- 0 Settlement Rd
- 3927 Mack Rd
- 3959 Braddock St
- 272 Hinman Dr
- 207 Caribe Dr
- 242 Maywood Dr
- 214 Maywood Dr
- 4022 Tallman Dr
- 3924 Old Trail Rd
- 270 Rose St
- 262 Indian Creek Rd
- 4067 Flintrock Way
- 3820 Murray Rd
- 4007 Horseshoe Rd
- 4178 Heathcliff Dr
- 4179 Heathcliff Dr
- 4015 Prescott Dr
- 3919 Miramar Drive Extension
- 3913 Miramar Drive Extension
- 3921 Miramar Drive Extension
- 3898 Almon Dr
- 3911 Miramar Drive Extension
- 3923 Miramar Drive Extension
- 3900 Almon Dr
- 3896 Almon Dr
- 3909 Miramar Drive Extension
- 3902 Almon Dr
- 3927 Miramar Drive Extension
- 3920 Miramar Ct
- 3907 Miramar Drive Extension
- 3904 Almon Dr
- 3894 Almon Dr
- 3922 Miramar Ct
- 3929 Miramar Drive Extension
- 3924 Miramar Ct
- 3905 Miramar Drive Extension
- 3931 Miramar Drive Extension