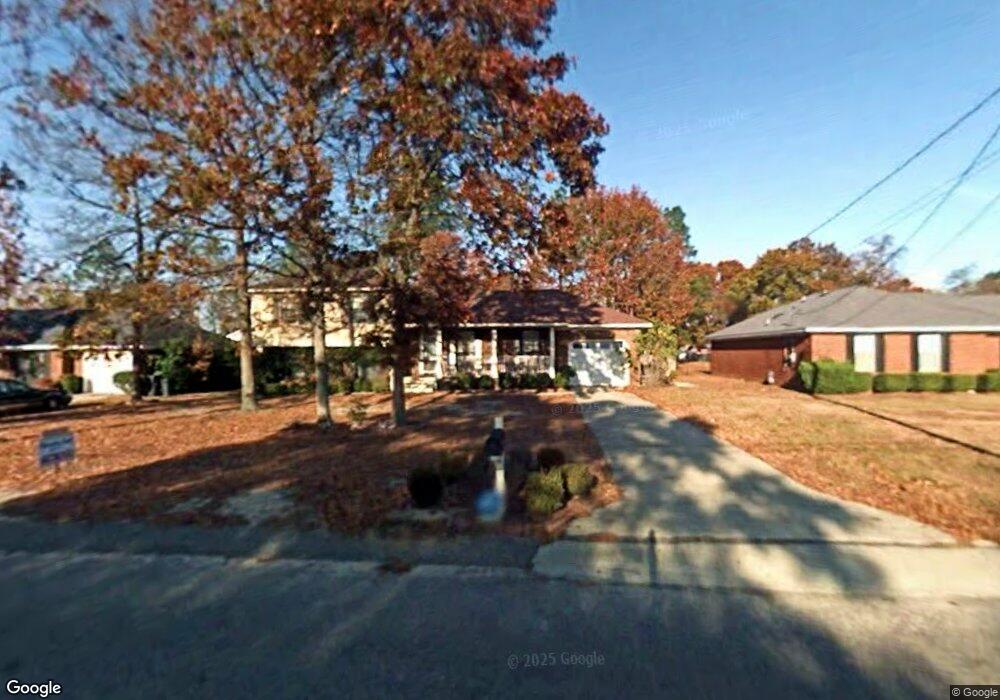
3919 Bowen Dr Hephzibah, GA 30815
Jamestown NeighborhoodEstimated Value: $239,000 - $257,000
4
Beds
3
Baths
2,386
Sq Ft
$104/Sq Ft
Est. Value
About This Home
This home is located at 3919 Bowen Dr, Hephzibah, GA 30815 and is currently estimated at $249,223, approximately $104 per square foot. 3919 Bowen Dr is a home located in Richmond County with nearby schools including Deer Chase Elementary School, Hephzibah Middle School, and Johnson Magnet.
Ownership History
Date
Name
Owned For
Owner Type
Purchase Details
Closed on
Jan 27, 2010
Sold by
American General Finl Svcs In
Bought by
Collier Risa M
Current Estimated Value
Home Financials for this Owner
Home Financials are based on the most recent Mortgage that was taken out on this home.
Original Mortgage
$107,908
Outstanding Balance
$71,071
Interest Rate
5.25%
Mortgage Type
FHA
Estimated Equity
$178,152
Purchase Details
Closed on
Aug 5, 2008
Sold by
Mckinney Sandra J and Mckinney Russell Sandra J
Bought by
American General Financial Services Inc
Purchase Details
Closed on
Aug 1, 1995
Sold by
Veterans Affairs Se
Bought by
Mckinney Sandra J
Purchase Details
Closed on
Mar 7, 1995
Sold by
First Union Mortgag
Bought by
Veterans Affairs Se
Purchase Details
Closed on
Aug 1, 1989
Sold by
Blackburn Home Buil
Bought by
Dawson Barbara L
Purchase Details
Closed on
Aug 1, 1988
Sold by
.Jefferson Contracto
Bought by
.E Blackburn Constru
Purchase Details
Closed on
Mar 1, 1988
Sold by
Nuite Ella Clarke
Bought by
.Jefferson Contracto
Create a Home Valuation Report for This Property
The Home Valuation Report is an in-depth analysis detailing your home's value as well as a comparison with similar homes in the area
Home Values in the Area
Average Home Value in this Area
Purchase History
| Date | Buyer | Sale Price | Title Company |
|---|---|---|---|
| Collier Risa M | $109,900 | -- | |
| American General Financial Services Inc | $99,800 | None Available | |
| American General Finance | $99,800 | -- | |
| Mckinney Sandra J | -- | -- | |
| Veterans Affairs Se | $76,800 | -- | |
| First Union Mortgag | $76,800 | -- | |
| Dawson Barbara L | $81,900 | -- | |
| .E Blackburn Constru | $63,000 | -- | |
| .Jefferson Contracto | $25,700 | -- |
Source: Public Records
Mortgage History
| Date | Status | Borrower | Loan Amount |
|---|---|---|---|
| Open | Collier Risa M | $107,908 |
Source: Public Records
Tax History
| Year | Tax Paid | Tax Assessment Tax Assessment Total Assessment is a certain percentage of the fair market value that is determined by local assessors to be the total taxable value of land and additions on the property. | Land | Improvement |
|---|---|---|---|---|
| 2025 | $2,667 | $84,332 | $7,200 | $77,132 |
| 2024 | $2,667 | $81,444 | $7,200 | $74,244 |
| 2023 | $1,714 | $75,084 | $7,200 | $67,884 |
| 2022 | $1,708 | $51,855 | $7,200 | $44,655 |
| 2021 | $1,518 | $41,514 | $7,200 | $34,314 |
| 2020 | $1,497 | $41,514 | $7,200 | $34,314 |
| 2019 | $1,577 | $41,514 | $7,200 | $34,314 |
| 2018 | $1,580 | $41,292 | $7,200 | $34,092 |
| 2017 | $1,539 | $41,292 | $7,200 | $34,092 |
| 2016 | $1,540 | $41,292 | $7,200 | $34,092 |
| 2015 | $1,550 | $41,292 | $7,200 | $34,092 |
| 2014 | $1,551 | $41,292 | $7,200 | $34,092 |
Source: Public Records
Map
Nearby Homes
- 3936 Ellen St
- 3716 Pinnacle Place Dr
- 3904 Ellen St
- 3823 Woodlake Dr
- 3714 Carrington Ct
- 3420 Firestone Dr Unit 157
- 3436 Firestone Dr
- 3438 Firestone Dr
- 3462 Firestone Dr
- 3748 Pinnacle Place Dr
- 3466 Firestone Dr
- 2604 Carrington Dr
- 3417 Firestone Dr Unit 85
- 3419 Firestone Dr Unit 86
- 3421 Firestone Dr Unit 87
- 4060 Pinnacle Way
- 3492 Firestone Dr
- 3762 Fairington Dr
- 5432 Thrasher Ln
- 2636 Carrington Dr
- 3917 Bowen Dr
- 3921 Bowen Dr
- 3810 Highpointe Dr
- 3923 Bowen Pier Dr
- 3923 Bowen Dr
- 3915 Bowen Dr
- 3812 Highpointe Dr
- 3924 Bowen Dr
- 3808 Highpointe Dr
- 3922 Bowen Dr
- 3814 Highpointe Dr
- 3926 Bowen Dr
- 3925 Bowen Dr
- 3920 Bowen Dr
- 3920 Bowen Pier Dr
- 3913 Bowen Dr
- 3928 Bowen Dr
- 3806 Highpointe Dr
- 3816 Highpointe Dr
- 3918 Bowen Dr
Your Personal Tour Guide
Ask me questions while you tour the home.