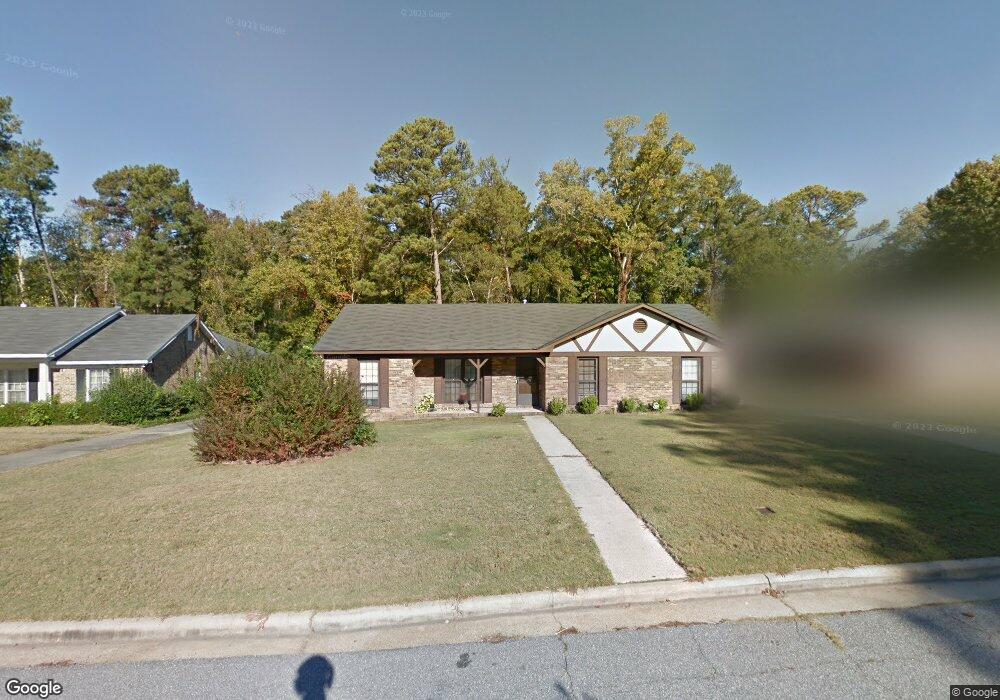
3919 Eve Ct Columbus, GA 31909
North Columbus NeighborhoodEstimated Value: $233,411 - $280,000
3
Beds
3
Baths
1,853
Sq Ft
$139/Sq Ft
Est. Value
About This Home
This home is located at 3919 Eve Ct, Columbus, GA 31909 and is currently estimated at $257,353, approximately $138 per square foot. 3919 Eve Ct is a home located in Muscogee County with nearby schools including Blanchard Elementary School, Veterans Memorial Middle School, and Hardaway High School.
Ownership History
Date
Name
Owned For
Owner Type
Purchase Details
Closed on
Aug 20, 2015
Sold by
Renfroe Michael L
Bought by
Chadwick Blake A and Chadwick Leslie N
Current Estimated Value
Home Financials for this Owner
Home Financials are based on the most recent Mortgage that was taken out on this home.
Original Mortgage
$159,065
Outstanding Balance
$126,031
Interest Rate
4.25%
Mortgage Type
FHA
Estimated Equity
$131,322
Create a Home Valuation Report for This Property
The Home Valuation Report is an in-depth analysis detailing your home's value as well as a comparison with similar homes in the area
Home Values in the Area
Average Home Value in this Area
Purchase History
| Date | Buyer | Sale Price | Title Company |
|---|---|---|---|
| Chadwick Blake A | $162,000 | -- |
Source: Public Records
Mortgage History
| Date | Status | Borrower | Loan Amount |
|---|---|---|---|
| Open | Chadwick Blake A | $159,065 |
Source: Public Records
Tax History
| Year | Tax Paid | Tax Assessment Tax Assessment Total Assessment is a certain percentage of the fair market value that is determined by local assessors to be the total taxable value of land and additions on the property. | Land | Improvement |
|---|---|---|---|---|
| 2025 | $3,071 | $78,452 | $10,988 | $67,464 |
| 2024 | $3,071 | $78,452 | $10,988 | $67,464 |
| 2023 | $3,090 | $78,452 | $10,988 | $67,464 |
| 2022 | $2,585 | $63,312 | $10,988 | $52,324 |
| 2021 | $2,371 | $58,064 | $10,988 | $47,076 |
| 2020 | $2,371 | $58,064 | $10,988 | $47,076 |
| 2019 | $2,379 | $58,064 | $10,988 | $47,076 |
| 2018 | $2,379 | $58,064 | $10,988 | $47,076 |
| 2017 | $2,386 | $58,064 | $10,988 | $47,076 |
| 2016 | $2,673 | $64,800 | $5,392 | $59,408 |
| 2015 | $896 | $67,508 | $5,392 | $62,116 |
| 2014 | $2,244 | $67,508 | $5,392 | $62,116 |
| 2013 | -- | $67,508 | $5,392 | $62,116 |
Source: Public Records
Map
Nearby Homes
- 2 Biltmore Ct
- 6104 Windsor Dr
- 4001 Twilight Dr
- 6002 Canterbury Dr
- 5829 Moon Rd
- 6411 Michael Ave
- 5820 Windsor Dr
- 4202 Cheshire Bridge Rd
- 3646 Weems Rd
- 3670 Weems Rd
- 6221 Charing Dr
- 4174 Will Rhoades Dr
- 6143 Brooklet Dr
- 3411 Tewson Dr
- 3325 N Quay Dr
- 3805 Gray Fox Dr
- 3342 Windermere St
- 6607 Hillbrook Ave
- 4320 Canady St
- 3710 Winkfield Place
Your Personal Tour Guide
Ask me questions while you tour the home.