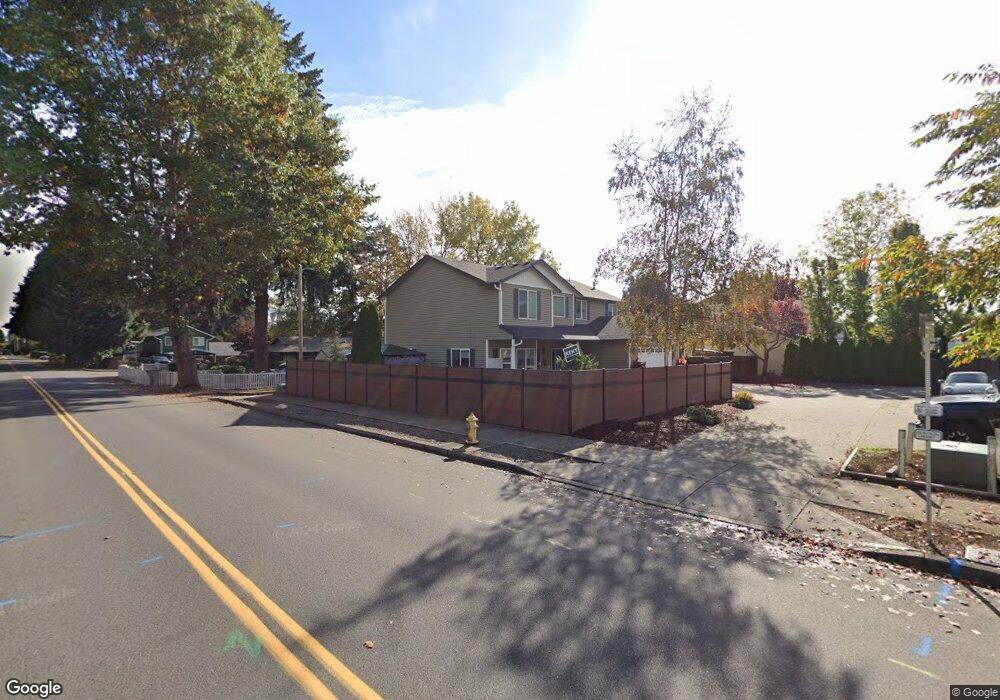
3919 NE 55th Ct Vancouver, WA 98661
Minnehaha NeighborhoodEstimated Value: $485,000 - $695,000
5
Beds
4
Baths
2,700
Sq Ft
$225/Sq Ft
Est. Value
About This Home
This home is located at 3919 NE 55th Ct, Vancouver, WA 98661 and is currently estimated at $608,212, approximately $225 per square foot. 3919 NE 55th Ct is a home located in Clark County with nearby schools including Harry S Truman Elementary School, Gaiser Middle School, and Fort Vancouver High School.
Ownership History
Date
Name
Owned For
Owner Type
Purchase Details
Closed on
Oct 7, 2021
Sold by
Mackey Lori A
Bought by
Kalini Karren M
Current Estimated Value
Home Financials for this Owner
Home Financials are based on the most recent Mortgage that was taken out on this home.
Original Mortgage
$260,000
Outstanding Balance
$237,096
Interest Rate
2.8%
Mortgage Type
New Conventional
Estimated Equity
$371,116
Purchase Details
Closed on
Aug 11, 2009
Sold by
Colemansmith Gary and Colemansmith Mark
Bought by
Mackey Lori A and Garner Donna M
Home Financials for this Owner
Home Financials are based on the most recent Mortgage that was taken out on this home.
Original Mortgage
$210,375
Interest Rate
5.09%
Mortgage Type
New Conventional
Purchase Details
Closed on
Jun 23, 2009
Sold by
White Gregory P and White Sherri L
Bought by
Colemansmith Gary and Colemansmith Mark
Home Financials for this Owner
Home Financials are based on the most recent Mortgage that was taken out on this home.
Original Mortgage
$210,375
Interest Rate
5.09%
Mortgage Type
New Conventional
Purchase Details
Closed on
Sep 18, 2007
Sold by
Gs White Llc
Bought by
White Gregory P and White Sherri L
Home Financials for this Owner
Home Financials are based on the most recent Mortgage that was taken out on this home.
Original Mortgage
$292,000
Interest Rate
7.75%
Mortgage Type
Purchase Money Mortgage
Purchase Details
Closed on
Jan 10, 2007
Sold by
T & M Properties Llc
Bought by
Gs White Llc
Home Financials for this Owner
Home Financials are based on the most recent Mortgage that was taken out on this home.
Original Mortgage
$302,000
Interest Rate
6.12%
Mortgage Type
Construction
Purchase Details
Closed on
Aug 4, 2006
Sold by
T & M Properties Llc
Bought by
Wilkins James and Wilkins Linda
Purchase Details
Closed on
Jul 31, 2006
Sold by
T & M Properties Llc
Bought by
Beebe Kathy M
Purchase Details
Closed on
Jun 28, 2004
Sold by
Millard Floyd W and Millard Gina S
Bought by
T & M Properties Llc
Purchase Details
Closed on
Jan 15, 2003
Sold by
Rider Esperanza T and Emelio Ulualoaiga
Bought by
Millard Floyd W and Millard Gina S
Purchase Details
Closed on
Dec 23, 1999
Sold by
Rider Esperanza Tiki
Bought by
Emelio Ulualoaiga and Rider Esperanza T
Home Financials for this Owner
Home Financials are based on the most recent Mortgage that was taken out on this home.
Original Mortgage
$100,000
Interest Rate
9.99%
Mortgage Type
Purchase Money Mortgage
Purchase Details
Closed on
Jan 17, 1997
Sold by
Patch Reuben A and Patch Maxine D
Bought by
Rider Clarence and Rider Tiki
Create a Home Valuation Report for This Property
The Home Valuation Report is an in-depth analysis detailing your home's value as well as a comparison with similar homes in the area
Home Values in the Area
Average Home Value in this Area
Purchase History
| Date | Buyer | Sale Price | Title Company |
|---|---|---|---|
| Kalini Karren M | -- | Ticor Title | |
| Mackey Lori A | -- | Ticor Title | |
| Mackey Lori A | $247,500 | Fidelity National Title | |
| Colemansmith Gary | $201,876 | None Available | |
| White Gregory P | -- | First American Title | |
| Gs White Llc | $110,000 | First American Title | |
| Wilkins James | -- | Accommodation | |
| Beebe Kathy M | -- | Accommodation | |
| Zack Dana J | -- | Accommodation | |
| T & M Properties Llc | -- | -- | |
| Millard Floyd W | -- | Cascade Title Of Clark Count | |
| Emelio Ulualoaiga | -- | Chicago Title Insurance Co | |
| Rider Clarence | -- | -- |
Source: Public Records
Mortgage History
| Date | Status | Borrower | Loan Amount |
|---|---|---|---|
| Open | Mackey Lori A | $260,000 | |
| Closed | Kalini Karren M | $260,000 | |
| Previous Owner | Mackey Lori A | $210,375 | |
| Previous Owner | White Gregory P | $292,000 | |
| Previous Owner | Gs White Llc | $302,000 | |
| Previous Owner | Emelio Ulualoaiga | $100,000 |
Source: Public Records
Tax History Compared to Growth
Tax History
| Year | Tax Paid | Tax Assessment Tax Assessment Total Assessment is a certain percentage of the fair market value that is determined by local assessors to be the total taxable value of land and additions on the property. | Land | Improvement |
|---|---|---|---|---|
| 2025 | $898 | $594,957 | $169,474 | $425,483 |
| 2024 | $845 | $572,742 | $169,474 | $403,268 |
| 2023 | $5,199 | $573,330 | $160,708 | $412,622 |
| 2022 | $2,955 | $552,675 | $169,474 | $383,201 |
| 2021 | $4,903 | $477,713 | $146,098 | $331,615 |
| 2020 | $4,341 | $447,807 | $124,801 | $323,006 |
| 2019 | $2,445 | $420,551 | $109,112 | $311,439 |
| 2018 | $2,643 | $263,297 | $0 | $0 |
| 2017 | $2,382 | $243,509 | $0 | $0 |
| 2016 | $3,850 | $229,202 | $0 | $0 |
| 2015 | $3,784 | $307,116 | $0 | $0 |
| 2014 | -- | $284,375 | $0 | $0 |
| 2013 | -- | $249,445 | $0 | $0 |
Source: Public Records
Map
Nearby Homes
- 5611 NE 38th St
- 5415 NE 34th St Unit C
- 5913 NE 34th St
- 5927 NE 34th St
- 6011 NE 33rd Cir
- 6113 NE 34th St
- 4501 NE 50th Ave
- 2833 NE Stapleton Rd
- 5301 Plomondon St Unit F24
- 4703 NE 60th Ave
- 5937 NE 48th St
- 6205 NE 47th St
- 6510 NE 43rd St
- 4456 NE Nicholson Loop
- 4319 NE 42nd St
- 3306 NE 43rd Place
- 4311 Plomondon St
- 5503 NE 53rd Cir
- 3317 Falk Rd
- 7012 NE 43rd St Unit A
- 5513 NE 40th St
- 3915 NE 55th Ct
- 3918 NE 55th Ct
- 3912 NE 56th Ave
- 5502 NE 40th St
- 3914 NE 55th Ct
- 5416 NE 40th St
- 5504 NE 39th St
- 5516 NE 40th St
- 5500 NE 39th St
- 5417 NE 40th St
- 5409 NE 40th St
- 3904 NE 56th Ave
- 3921 NE 56th Ave
- 5508 NE 40th St
- 5408 NE 40th St
- 5520 NE 40th St
- 3913 NE 56th Ave
- 4001 NE 54th Ave
- 3913 NE 54th Ave