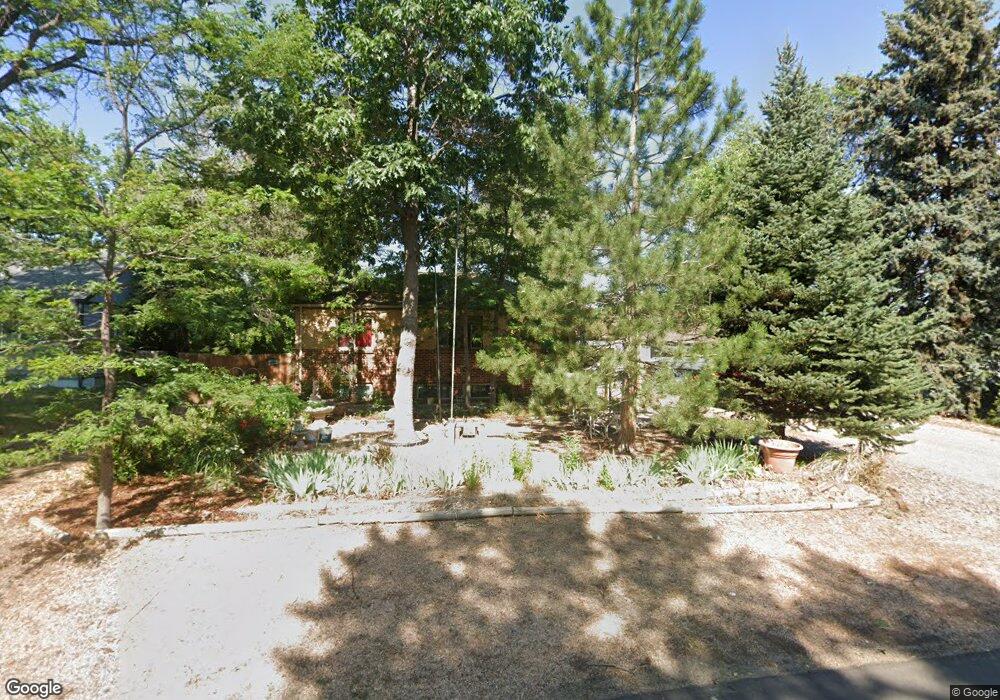
3919 Quay St Wheat Ridge, CO 80033
Barths NeighborhoodEstimated Value: $585,000 - $649,000
3
Beds
3
Baths
1,017
Sq Ft
$608/Sq Ft
Est. Value
About This Home
This home is located at 3919 Quay St, Wheat Ridge, CO 80033 and is currently estimated at $618,728, approximately $608 per square foot. 3919 Quay St is a home located in Jefferson County with nearby schools including Stevens Elementary School, Everitt Middle School, and Wheat Ridge High School.
Ownership History
Date
Name
Owned For
Owner Type
Purchase Details
Closed on
Nov 8, 2016
Sold by
Rossow Jay R and Garcia Andrew Florentino
Bought by
Rossow Jay R and Garcia Andrew Florentino
Current Estimated Value
Purchase Details
Closed on
Oct 5, 2005
Sold by
Rossow Jay R
Bought by
Garcia Andrew Florentino and Rossow Jay R
Purchase Details
Closed on
Mar 23, 2001
Sold by
Abell Michael L
Bought by
Rossow Jay R
Home Financials for this Owner
Home Financials are based on the most recent Mortgage that was taken out on this home.
Original Mortgage
$178,000
Interest Rate
6.98%
Purchase Details
Closed on
Aug 28, 2000
Sold by
Dee Sandoval Sally
Bought by
Abell Michael L
Home Financials for this Owner
Home Financials are based on the most recent Mortgage that was taken out on this home.
Original Mortgage
$128,000
Interest Rate
8.15%
Create a Home Valuation Report for This Property
The Home Valuation Report is an in-depth analysis detailing your home's value as well as a comparison with similar homes in the area
Home Values in the Area
Average Home Value in this Area
Purchase History
| Date | Buyer | Sale Price | Title Company |
|---|---|---|---|
| Rossow Jay R | -- | None Available | |
| Garcia Andrew Florentino | -- | -- | |
| Rossow Jay R | $245,900 | North American Title Co | |
| Abell Michael L | $160,000 | First American Heritage Titl |
Source: Public Records
Mortgage History
| Date | Status | Borrower | Loan Amount |
|---|---|---|---|
| Previous Owner | Rossow Jay R | $178,000 | |
| Previous Owner | Abell Michael L | $128,000 |
Source: Public Records
Tax History Compared to Growth
Tax History
| Year | Tax Paid | Tax Assessment Tax Assessment Total Assessment is a certain percentage of the fair market value that is determined by local assessors to be the total taxable value of land and additions on the property. | Land | Improvement |
|---|---|---|---|---|
| 2024 | $3,117 | $35,649 | $17,624 | $18,025 |
| 2023 | $3,117 | $35,649 | $17,624 | $18,025 |
| 2022 | $2,753 | $30,924 | $17,402 | $13,522 |
| 2021 | $2,791 | $31,813 | $17,902 | $13,911 |
| 2020 | $2,516 | $28,817 | $16,267 | $12,550 |
| 2019 | $2,482 | $28,817 | $16,267 | $12,550 |
| 2018 | $2,179 | $24,448 | $10,402 | $14,046 |
| 2017 | $1,967 | $24,448 | $10,402 | $14,046 |
| 2016 | $1,730 | $20,114 | $6,280 | $13,834 |
| 2015 | $1,463 | $20,114 | $6,280 | $13,834 |
| 2014 | $1,463 | $15,960 | $5,731 | $10,229 |
Source: Public Records
Map
Nearby Homes
- 4095 Quay St
- 4125 Pierce St
- 4014 Upham St
- 3830 Pierce St
- 3820 Pierce St
- 4026 Upham St
- 4008 Upham St
- 4024 Upham St
- 3830 Otis St Unit 1-4
- 7010 W 44th Ave
- 6735 W 37th Place
- 6455 W 38th Ave
- 4420 Teller St
- 3728 Vance St Unit 1-4
- 3535 High Ct
- 3500 Otis St
- 4541 Reed St
- 6145 W 38th Ave
- 7801 W 39th Ave
- 4295 Harlan St