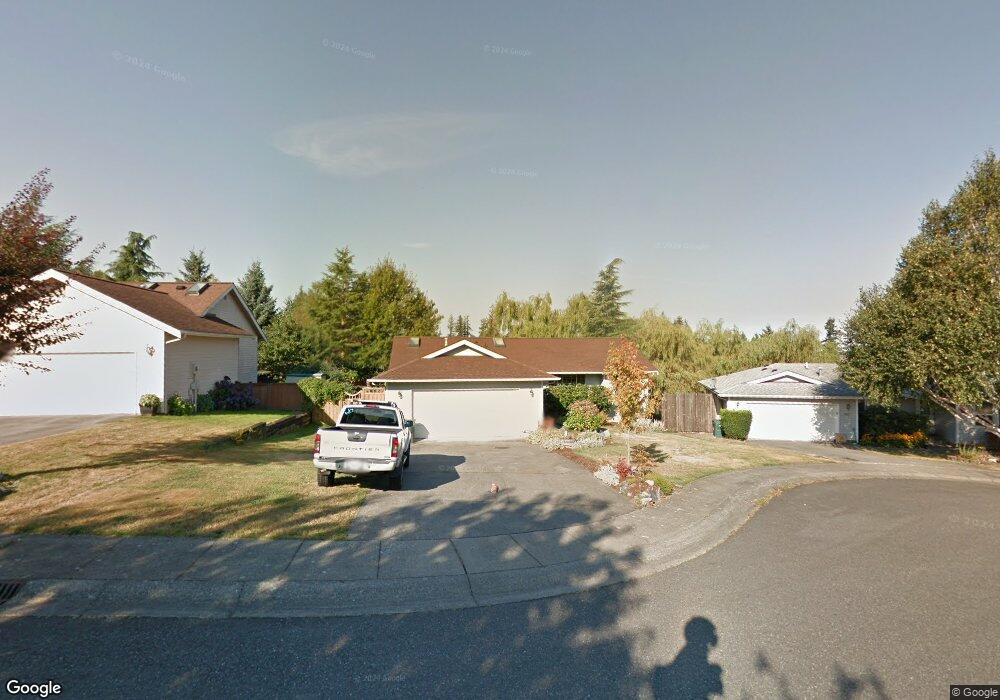
3919 Timothy Ct Bellingham, WA 98226
Estimated Value: $558,000 - $658,000
3
Beds
2
Baths
1,387
Sq Ft
$432/Sq Ft
Est. Value
About This Home
This home is located at 3919 Timothy Ct, Bellingham, WA 98226 and is currently estimated at $599,178, approximately $431 per square foot. 3919 Timothy Ct is a home located in Whatcom County with nearby schools including Northern Heights Elementary School, Shuksan Middle School, and Squalicum High School.
Ownership History
Date
Name
Owned For
Owner Type
Purchase Details
Closed on
Oct 1, 2025
Sold by
Pratt Scott A
Bought by
Garcia Bryce Mitchell and Garcia Kanishya Marie
Current Estimated Value
Home Financials for this Owner
Home Financials are based on the most recent Mortgage that was taken out on this home.
Original Mortgage
$274,000
Outstanding Balance
$274,000
Interest Rate
5.63%
Mortgage Type
New Conventional
Estimated Equity
$325,178
Purchase Details
Closed on
Jan 12, 2024
Sold by
Pratt Rebecca Lynn
Bought by
Pratt Scott A
Home Financials for this Owner
Home Financials are based on the most recent Mortgage that was taken out on this home.
Original Mortgage
$526,658
Interest Rate
7.03%
Mortgage Type
FHA
Purchase Details
Closed on
Mar 16, 2004
Sold by
Elmendorf Tyson and Elmendorf Shannon
Bought by
Pratt Scott and Pratt Rebecca
Home Financials for this Owner
Home Financials are based on the most recent Mortgage that was taken out on this home.
Original Mortgage
$159,920
Interest Rate
5.69%
Mortgage Type
Purchase Money Mortgage
Purchase Details
Closed on
Sep 10, 1999
Sold by
Simpson Mark L and Simpson Christine C
Bought by
Elmendorf Tyson
Home Financials for this Owner
Home Financials are based on the most recent Mortgage that was taken out on this home.
Original Mortgage
$140,505
Interest Rate
7.89%
Create a Home Valuation Report for This Property
The Home Valuation Report is an in-depth analysis detailing your home's value as well as a comparison with similar homes in the area
Home Values in the Area
Average Home Value in this Area
Purchase History
| Date | Buyer | Sale Price | Title Company |
|---|---|---|---|
| Garcia Bryce Mitchell | $560,000 | Chicago Title | |
| Pratt Scott A | $18,719 | First American Title | |
| Pratt Scott | $171,824 | Chicago Title Insurance | |
| Elmendorf Tyson | $127,127 | First American Title Ins Co |
Source: Public Records
Mortgage History
| Date | Status | Borrower | Loan Amount |
|---|---|---|---|
| Open | Garcia Bryce Mitchell | $274,000 | |
| Previous Owner | Pratt Scott A | $526,658 | |
| Previous Owner | Pratt Scott | $159,920 | |
| Previous Owner | Elmendorf Tyson | $140,505 | |
| Closed | Pratt Scott | $39,980 |
Source: Public Records
Tax History Compared to Growth
Tax History
| Year | Tax Paid | Tax Assessment Tax Assessment Total Assessment is a certain percentage of the fair market value that is determined by local assessors to be the total taxable value of land and additions on the property. | Land | Improvement |
|---|---|---|---|---|
| 2024 | $5,155 | $586,389 | $242,352 | $344,037 |
| 2023 | $5,155 | $612,179 | $253,011 | $359,168 |
| 2022 | $4,086 | $497,707 | $205,700 | $292,007 |
| 2021 | $3,818 | $411,328 | $170,000 | $241,328 |
| 2020 | $3,725 | $361,346 | $132,405 | $228,941 |
| 2019 | $3,316 | $337,621 | $123,803 | $213,818 |
| 2018 | $3,438 | $302,825 | $111,053 | $191,772 |
| 2017 | $2,994 | $267,941 | $98,260 | $169,681 |
| 2016 | $2,765 | $243,522 | $89,420 | $154,102 |
| 2015 | $2,799 | $231,974 | $85,000 | $146,974 |
| 2014 | -- | $228,347 | $87,720 | $140,627 |
| 2013 | -- | $218,898 | $85,000 | $133,898 |
Source: Public Records
Map
Nearby Homes
- 1367 Roma Rd
- 1430 Welling Rd
- 3852 Del Bonita Way
- 1314 Welling Rd
- 3785 Greenville Place
- 3871 Cindy Ln
- 1464 Greenville Dr
- 3606 Tree Farm Ct
- 3715 E Sunset Dr
- 3713 Bristol St
- 3709 Bristol St
- 1580 Hillsdale Rd
- 4121 Malachite Dr
- 3826 Gala Loop
- 4136 Malachite Dr
- 3010 E Sunset Dr
- 3001 E Sunset Dr
- 3527 Sussex Dr
- 3666 Woodlake Rd
- 1812 Squalicum Mountain Rd
- 3915 Timothy Ct
- 3923 Timothy Ct
- 3914 Tamarack Rd
- 3909 Timothy Ct
- 3910 Tamarack Rd
- 3929 Timothy Ct
- 3906 Tamarack Rd
- 3922 Tamarack Rd
- 3918 Timothy Ct
- 3914 Timothy Ct
- 3901 Timothy Ct
- 3928 Timothy Ct
- 3908 Timothy Ct
- 3922 Timothy Ct
- 3926 Tamarack Rd
- 3902 Tamarack Rd
- 3986 Roma Ct
- 3982 Roma Ct
- 3990 Roma Ct