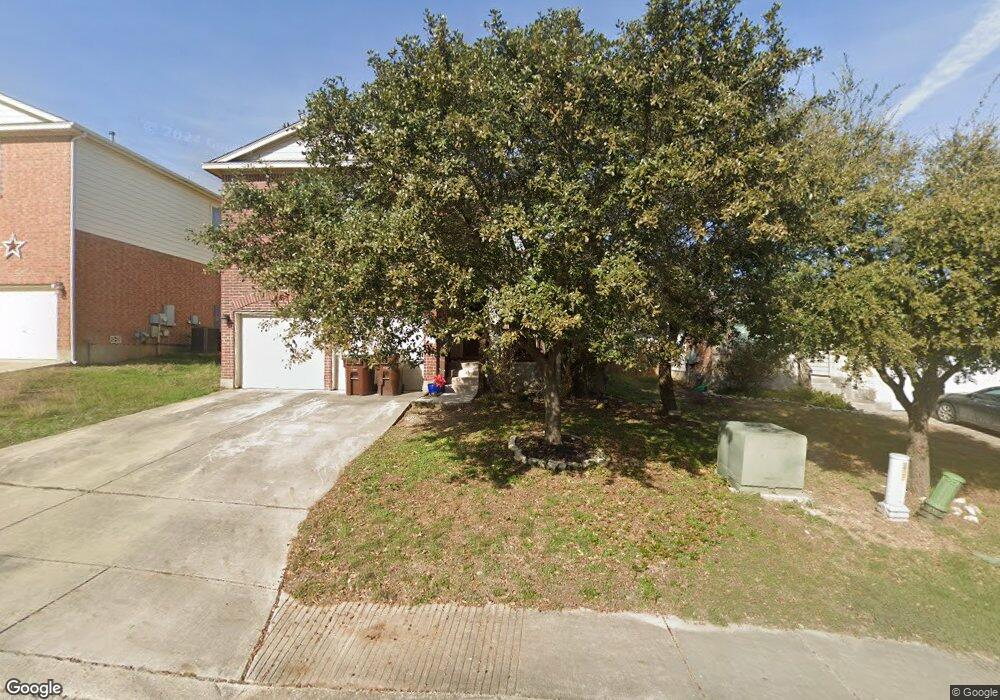
3919 Valencia Peak San Antonio, TX 78261
Bulverde Village NeighborhoodEstimated Value: $338,000 - $366,000
3
Beds
3
Baths
2,371
Sq Ft
$147/Sq Ft
Est. Value
About This Home
This home is located at 3919 Valencia Peak, San Antonio, TX 78261 and is currently estimated at $348,210, approximately $146 per square foot. 3919 Valencia Peak is a home located in Bexar County with nearby schools including Cibolo Green Elementary School, David Lee "Tex" Hill Middle School, and Johnson High School.
Ownership History
Date
Name
Owned For
Owner Type
Purchase Details
Closed on
Aug 13, 2014
Sold by
Nava Danielle Marie
Bought by
Padilla Cales Travis Wade and Padilla Cales Yareli
Current Estimated Value
Home Financials for this Owner
Home Financials are based on the most recent Mortgage that was taken out on this home.
Original Mortgage
$205,321
Outstanding Balance
$156,849
Interest Rate
4.16%
Mortgage Type
VA
Estimated Equity
$191,361
Purchase Details
Closed on
Jun 28, 2006
Sold by
Pulte Homes Of Texas Lp
Bought by
Nava Jason C and Nava Danielle M
Home Financials for this Owner
Home Financials are based on the most recent Mortgage that was taken out on this home.
Original Mortgage
$139,619
Interest Rate
7.37%
Mortgage Type
Purchase Money Mortgage
Create a Home Valuation Report for This Property
The Home Valuation Report is an in-depth analysis detailing your home's value as well as a comparison with similar homes in the area
Home Values in the Area
Average Home Value in this Area
Purchase History
| Date | Buyer | Sale Price | Title Company |
|---|---|---|---|
| Padilla Cales Travis Wade | -- | Ttt | |
| Nava Jason C | -- | Fatco | |
| Nava Jason C | -- | Fatco |
Source: Public Records
Mortgage History
| Date | Status | Borrower | Loan Amount |
|---|---|---|---|
| Open | Padilla Cales Travis Wade | $205,321 | |
| Previous Owner | Nava Jason C | $139,619 |
Source: Public Records
Tax History Compared to Growth
Tax History
| Year | Tax Paid | Tax Assessment Tax Assessment Total Assessment is a certain percentage of the fair market value that is determined by local assessors to be the total taxable value of land and additions on the property. | Land | Improvement |
|---|---|---|---|---|
| 2025 | $6,114 | $343,820 | $66,940 | $276,880 |
| 2024 | $6,114 | $347,140 | $66,940 | $280,200 |
| 2023 | $6,114 | $345,120 | $66,940 | $278,180 |
| 2022 | $6,675 | $334,990 | $55,810 | $279,180 |
| 2021 | $5,109 | $247,000 | $48,560 | $198,440 |
| 2020 | $4,911 | $232,740 | $45,180 | $187,560 |
| 2019 | $4,995 | $231,760 | $45,180 | $186,580 |
| 2018 | $4,812 | $222,800 | $45,180 | $177,620 |
| 2017 | $4,776 | $218,850 | $45,180 | $173,670 |
| 2016 | $4,610 | $211,240 | $45,180 | $166,060 |
| 2015 | $4,161 | $200,280 | $32,500 | $167,780 |
| 2014 | $4,161 | $194,070 | $0 | $0 |
Source: Public Records
Map
Nearby Homes
- 25514 Thomas Oaks
- 3911 Valencia Peak
- 25615 Coral Vine
- 3430 Marlark Pass
- 3618 Mendocino Park
- 25726 Willard Path
- 25707 Preserve Crest
- 3330 Marlark Pass
- 25268 Cambridge Well
- 3718 Pinyon Pine
- 3326 Marlark Pass
- 25135 Longbranch Run
- 3619 Sumantra Cliff
- 25346 Colt River
- 3302 Bending Creek
- 25035 Longbranch Run
- 25214 Judson Bend
- 3818 Sweet Olive
- 3134 Howling Wolf
- 3819 Running Ranch
- 3915 Valencia Peak
- 3923 Valencia Peak
- 3642 Marlark Pass
- 3927 Valencia Peak
- 3863 Bennington Way
- 3638 Marlark Pass
- 3907 Valencia Peak
- 3646 Marlark Pass
- 3931 Valencia Peak
- 3854 Sumantra Cliff
- 3859 Bennington Way
- 3866 Bennington Way
- 3634 Marlark Pass
- 3903 Valencia Peak
- 3862 Bennington Way
- 3850 Sumantra Cliff
- 3855 Bennington Way
- 3630 Marlark Pass
- 3858 Bennington Way
- 3843 Valencia Peak