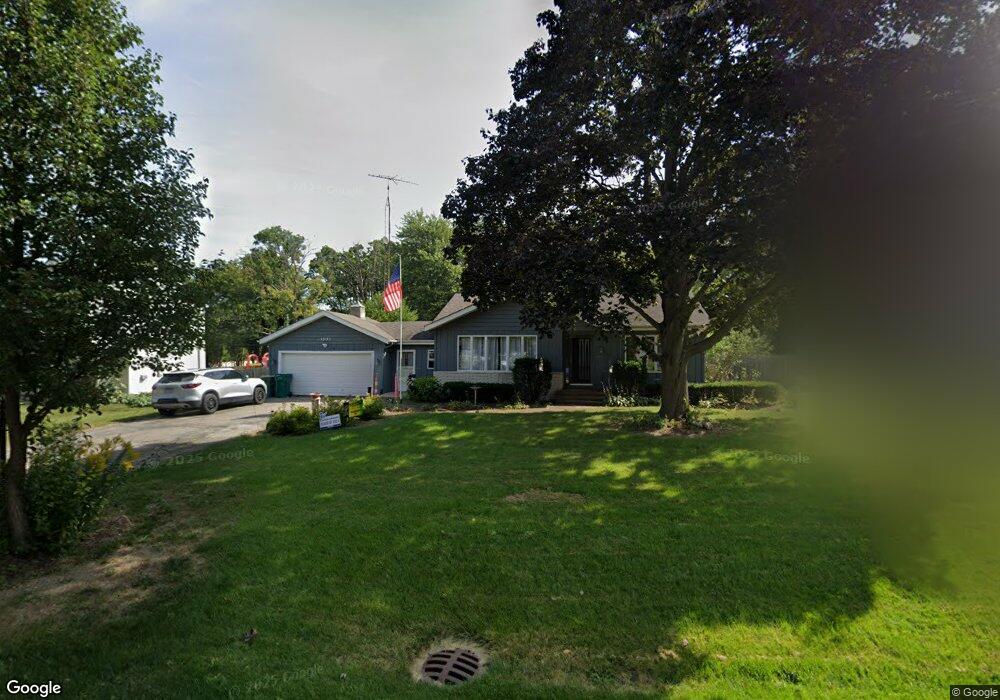
39193 N Poplar St Lake Villa, IL 60046
Estimated Value: $239,776 - $252,000
2
Beds
2
Baths
1,090
Sq Ft
$224/Sq Ft
Est. Value
About This Home
This home is located at 39193 N Poplar St, Lake Villa, IL 60046 and is currently estimated at $244,194, approximately $224 per square foot. 39193 N Poplar St is a home located in Lake County with nearby schools including Lakes Community High School.
Ownership History
Date
Name
Owned For
Owner Type
Purchase Details
Closed on
Feb 11, 2002
Sold by
Soltis Jennifer
Bought by
Mazik Peter V and Mazik Kathy L
Current Estimated Value
Home Financials for this Owner
Home Financials are based on the most recent Mortgage that was taken out on this home.
Original Mortgage
$155,558
Outstanding Balance
$63,821
Interest Rate
6.95%
Mortgage Type
FHA
Estimated Equity
$180,373
Purchase Details
Closed on
Aug 3, 2001
Sold by
Cripe Richard L
Bought by
Soltis Jennifer L
Purchase Details
Closed on
Mar 30, 2001
Sold by
Fuller Albert E and Fuller Colleen M
Bought by
Cripe Richard L and Soltis Jennifer L
Home Financials for this Owner
Home Financials are based on the most recent Mortgage that was taken out on this home.
Original Mortgage
$137,735
Interest Rate
7.05%
Mortgage Type
FHA
Create a Home Valuation Report for This Property
The Home Valuation Report is an in-depth analysis detailing your home's value as well as a comparison with similar homes in the area
Home Values in the Area
Average Home Value in this Area
Purchase History
| Date | Buyer | Sale Price | Title Company |
|---|---|---|---|
| Mazik Peter V | $158,000 | -- | |
| Soltis Jennifer L | -- | Chicago Title Insurance Co | |
| Cripe Richard L | $140,000 | -- |
Source: Public Records
Mortgage History
| Date | Status | Borrower | Loan Amount |
|---|---|---|---|
| Open | Mazik Peter V | $155,558 | |
| Previous Owner | Cripe Richard L | $137,735 |
Source: Public Records
Tax History Compared to Growth
Tax History
| Year | Tax Paid | Tax Assessment Tax Assessment Total Assessment is a certain percentage of the fair market value that is determined by local assessors to be the total taxable value of land and additions on the property. | Land | Improvement |
|---|---|---|---|---|
| 2024 | $4,659 | $61,213 | $4,629 | $56,584 |
| 2023 | $4,523 | $54,085 | $4,090 | $49,995 |
| 2022 | $4,523 | $49,922 | $3,964 | $45,958 |
| 2021 | $4,270 | $46,374 | $3,682 | $42,692 |
| 2020 | $4,163 | $44,888 | $3,564 | $41,324 |
| 2019 | $4,285 | $43,141 | $3,425 | $39,716 |
| 2018 | $3,287 | $35,797 | $3,829 | $31,968 |
| 2017 | $3,183 | $34,842 | $3,727 | $31,115 |
| 2016 | $3,254 | $33,431 | $3,576 | $29,855 |
| 2015 | $3,089 | $31,224 | $3,340 | $27,884 |
| 2014 | $3,168 | $32,148 | $3,322 | $28,826 |
| 2012 | $3,586 | $32,303 | $3,338 | $28,965 |
Source: Public Records
Map
Nearby Homes
- 38947 Deep Lake Rd
- 21696 W Willow St
- 21584 W Lake Ave
- 1035 Rushing Ct
- 21621 W Cedar Ave
- 21990 W 6th St
- 777 Spring Cir S
- 724 Porter Cir
- 725 Porter Cir
- 705 Porter Cir
- 433 Woodland Trail
- 437 Woodland Trail
- 434 Woodland Trail
- 807 Wedgewood Ct
- 428 Woodland Trail
- 420 Woodland Trail
- 1650 Natures Way
- 234 N Crooked Lake Ln
- 405 Woodland Trail
- 411 Hubbard Ln
- 39181 N Poplar St
- 39219 N Poplar St
- 39169 N Poplar St
- 39235 N Poplar St
- 39167 N Poplar St
- 39202 N Poplar St
- 39180 N Poplar St
- 39149 N Poplar St
- 39182 N Rustic Dr
- 39210 N Rustic Dr
- 39156 N Poplar St
- 39164 N Rustic Dr
- 39232 N Rustic Dr
- 39244 N Poplar St
- 39181 N Spruce St
- 39148 N Poplar St
- 39191 N Spruce St
- 39127 N Poplar St
- 39169 N Spruce St
- 39203 N Spruce St