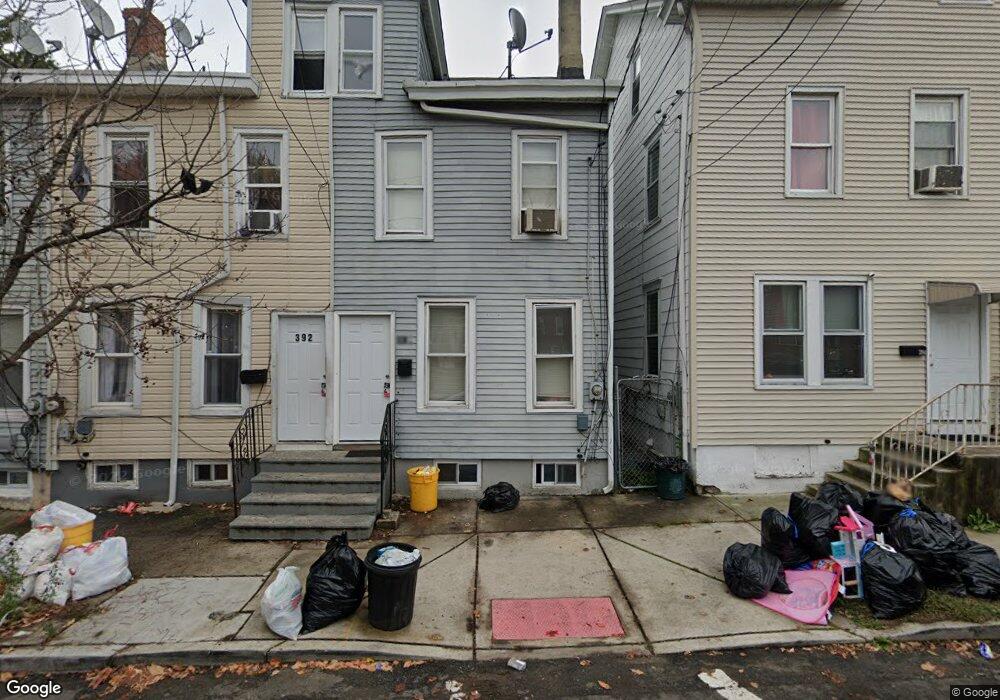
392 3rd St Trenton, NJ 08611
South Trenton NeighborhoodEstimated Value: $121,709 - $186,000
--
Bed
--
Bath
860
Sq Ft
$185/Sq Ft
Est. Value
About This Home
This home is located at 392 3rd St, Trenton, NJ 08611 and is currently estimated at $158,677, approximately $184 per square foot. 392 3rd St is a home located in Mercer County with nearby schools including Mott Elementary School, Parker Elementary School, and Grace A Dunn Middle School.
Ownership History
Date
Name
Owned For
Owner Type
Purchase Details
Closed on
May 22, 2016
Sold by
Engel David
Bought by
392 Third Street Llc
Current Estimated Value
Purchase Details
Closed on
May 18, 2016
Sold by
Aronson Chaya
Bought by
Engel David
Purchase Details
Closed on
Apr 22, 2013
Sold by
Frenkel Yehoshua
Bought by
Aronson Chaya
Purchase Details
Closed on
Aug 23, 2012
Sold by
Thomson Robert A and Thomson Danita S
Bought by
Frenkel Yehoshua
Purchase Details
Closed on
Nov 5, 2004
Sold by
Chestnut Properties 2001 Llc
Bought by
Thompson Robert and Thompson Danita
Home Financials for this Owner
Home Financials are based on the most recent Mortgage that was taken out on this home.
Original Mortgage
$90,250
Interest Rate
5.73%
Purchase Details
Closed on
Jul 15, 2004
Sold by
Yuousaf Mohammad
Bought by
Chestnut Properties 2001 Llc
Create a Home Valuation Report for This Property
The Home Valuation Report is an in-depth analysis detailing your home's value as well as a comparison with similar homes in the area
Home Values in the Area
Average Home Value in this Area
Purchase History
| Date | Buyer | Sale Price | Title Company |
|---|---|---|---|
| 392 Third Street Llc | -- | None Available | |
| Engel David | -- | The Security Title Guarantee | |
| Aronson Chaya | $36,000 | Agent For Thte Security Titl | |
| Frenkel Yehoshua | $16,000 | None Available | |
| Thompson Robert | $95,000 | -- | |
| Chestnut Properties 2001 Llc | $25,000 | -- |
Source: Public Records
Mortgage History
| Date | Status | Borrower | Loan Amount |
|---|---|---|---|
| Previous Owner | Thompson Robert | $90,250 |
Source: Public Records
Tax History Compared to Growth
Tax History
| Year | Tax Paid | Tax Assessment Tax Assessment Total Assessment is a certain percentage of the fair market value that is determined by local assessors to be the total taxable value of land and additions on the property. | Land | Improvement |
|---|---|---|---|---|
| 2025 | $2,152 | $37,100 | $7,200 | $29,900 |
| 2024 | $2,065 | $37,100 | $7,200 | $29,900 |
| 2023 | $2,065 | $37,100 | $7,200 | $29,900 |
| 2022 | $2,025 | $37,100 | $7,200 | $29,900 |
| 2021 | $2,060 | $37,100 | $7,200 | $29,900 |
| 2020 | $2,053 | $37,100 | $7,200 | $29,900 |
| 2019 | $2,020 | $37,100 | $7,200 | $29,900 |
| 2018 | $1,934 | $37,100 | $7,200 | $29,900 |
| 2017 | $1,838 | $37,100 | $7,200 | $29,900 |
| 2016 | $2,554 | $44,400 | $12,000 | $32,400 |
| 2015 | $3,325 | $58,000 | $12,000 | $46,000 |
| 2014 | $3,309 | $58,000 | $12,000 | $46,000 |
Source: Public Records
Map
Nearby Homes