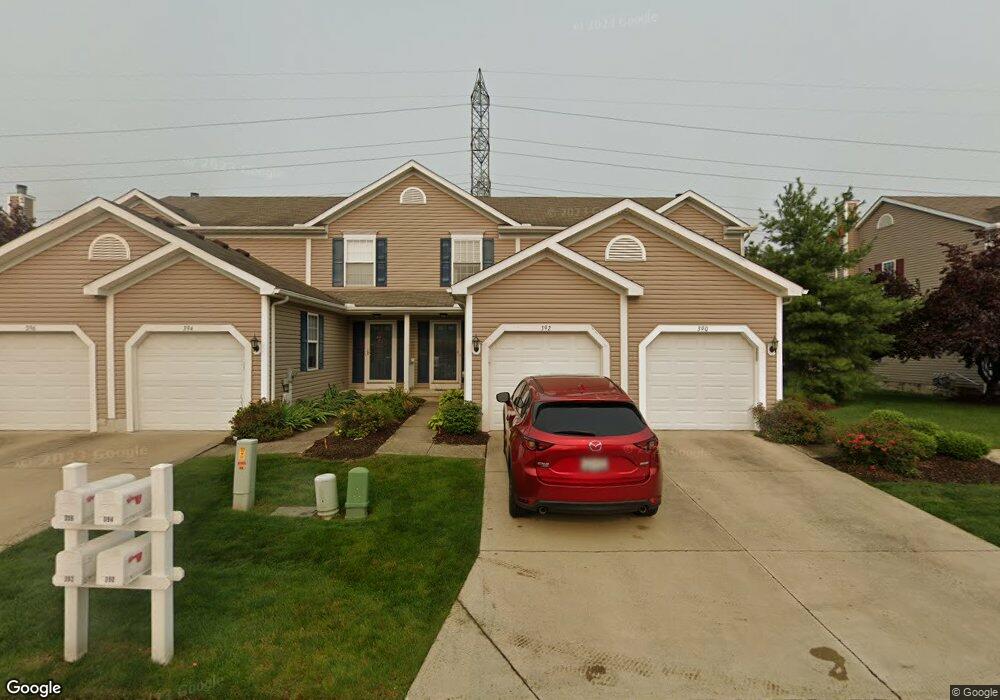
392 Angela Ln Unit 19C Avon Lake, OH 44012
Estimated Value: $199,000 - $217,000
2
Beds
2
Baths
1,080
Sq Ft
$195/Sq Ft
Est. Value
About This Home
This home is located at 392 Angela Ln Unit 19C, Avon Lake, OH 44012 and is currently estimated at $210,638, approximately $195 per square foot. 392 Angela Ln Unit 19C is a home located in Lorain County with nearby schools including Westview Elementary School, Troy Intermediate Elementary School, and Learwood Middle School.
Ownership History
Date
Name
Owned For
Owner Type
Purchase Details
Closed on
Jun 10, 2025
Sold by
Mack Melissa
Bought by
Ishac George
Current Estimated Value
Purchase Details
Closed on
Jul 26, 2016
Sold by
Nelson Jessica R
Bought by
Mack Melissa
Home Financials for this Owner
Home Financials are based on the most recent Mortgage that was taken out on this home.
Original Mortgage
$101,850
Interest Rate
3.48%
Mortgage Type
New Conventional
Purchase Details
Closed on
Jul 27, 2009
Sold by
William Thomas Homes Inc
Bought by
Nelson Jessica R
Home Financials for this Owner
Home Financials are based on the most recent Mortgage that was taken out on this home.
Original Mortgage
$103,098
Interest Rate
5.43%
Mortgage Type
FHA
Purchase Details
Closed on
Mar 16, 2007
Sold by
William Thomas Communities Inc
Bought by
William Thomas Homes Inc
Create a Home Valuation Report for This Property
The Home Valuation Report is an in-depth analysis detailing your home's value as well as a comparison with similar homes in the area
Home Values in the Area
Average Home Value in this Area
Purchase History
| Date | Buyer | Sale Price | Title Company |
|---|---|---|---|
| Ishac George | $200,000 | Miller Home Title | |
| Mack Melissa | $105,000 | Fidelity National Title | |
| Nelson Jessica R | $105,000 | Stewart Real Estate Title | |
| William Thomas Homes Inc | -- | Accommodation |
Source: Public Records
Mortgage History
| Date | Status | Borrower | Loan Amount |
|---|---|---|---|
| Previous Owner | Mack Melissa | $101,850 | |
| Previous Owner | Nelson Jessica R | $103,098 |
Source: Public Records
Tax History Compared to Growth
Tax History
| Year | Tax Paid | Tax Assessment Tax Assessment Total Assessment is a certain percentage of the fair market value that is determined by local assessors to be the total taxable value of land and additions on the property. | Land | Improvement |
|---|---|---|---|---|
| 2024 | $2,944 | $60,585 | $14,973 | $45,612 |
| 2023 | $2,398 | $43,876 | $9,587 | $34,290 |
| 2022 | $2,374 | $43,876 | $9,587 | $34,290 |
| 2021 | $2,368 | $43,876 | $9,587 | $34,290 |
| 2020 | $2,170 | $37,250 | $8,140 | $29,110 |
| 2019 | $2,159 | $37,250 | $8,140 | $29,110 |
| 2018 | $2,107 | $37,250 | $8,140 | $29,110 |
| 2017 | $1,989 | $32,370 | $6,770 | $25,600 |
| 2016 | $1,979 | $32,370 | $6,770 | $25,600 |
| 2015 | $1,989 | $32,370 | $6,770 | $25,600 |
| 2014 | $2,429 | $37,680 | $7,880 | $29,800 |
| 2013 | $2,447 | $37,680 | $7,880 | $29,800 |
Source: Public Records
Map
Nearby Homes
- 342 Angela Ln
- 216 Moore Rd Unit 1-V
- 216 Moore Rd Unit 1K
- 216 Moore Rd Unit 4R
- 216 Moore Rd Unit 1E
- 438 Rachel Ln
- 457 Rachel Ln Unit 7
- 33409 Chatham Dr
- 33185 Brookcrest Place
- 33316 Ambleside Dr
- 33165 Brookcrest Place
- 599 Crossings Way
- 33803 Electric Blvd Unit H20
- 33803 Electric Blvd Unit H17
- 346 Waterside Dr
- 175 Curtis Dr
- 423 Clipper Ct
- 462 Caravel Ct
- 442 Caravel Ct
- Mystique Plan at Port West - Retreat
- 392 Angela Ln Unit 71
- 390 Angela Ln Unit 72
- 394 Angela Ln Unit 70
- 394 Angela Ln Unit 19B
- 396 Angela Ln Unit 69
- 396 Angela Ln Unit 19A
- 380 Angela Ln Unit 73
- 380 Angela Ln Unit 18A
- 378 Angela Ln Unit 74
- 402 Angela Ln Unit 50
- 374 Angela Ln Unit 75
- 404 Angela Ln Unit 49
- 372 Angela Ln Unit 76
- 406 Angela Ln Unit 48
- 391 Angela Ln Unit 55
- 389 Angela Ln Unit 56
- 385 Angela Ln Unit 385
- 399 Angela Ln Unit 53
- 408 Angela Ln
- 383 Angela Ln Unit 58