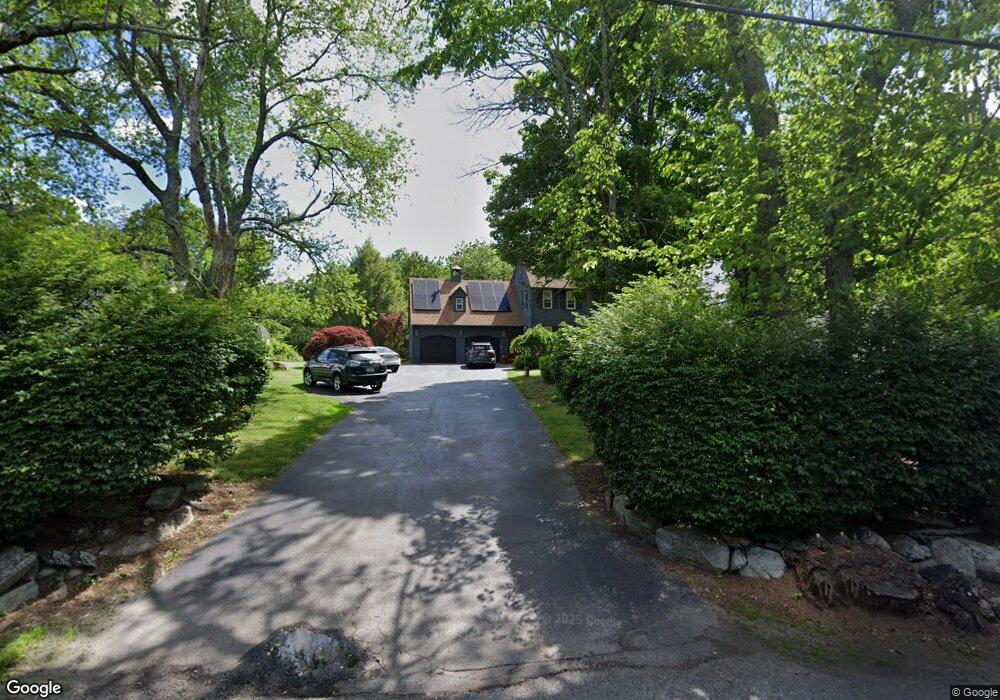
392 Ash St West Bridgewater, MA 02379
Estimated Value: $728,000 - $930,000
3
Beds
3
Baths
3,719
Sq Ft
$224/Sq Ft
Est. Value
About This Home
This home is located at 392 Ash St, West Bridgewater, MA 02379 and is currently estimated at $832,314, approximately $223 per square foot. 392 Ash St is a home located in Plymouth County with nearby schools including Spring Street Elementary School, Howard Elementary School, and Rose L. MacDonald Elementary School.
Ownership History
Date
Name
Owned For
Owner Type
Purchase Details
Closed on
Jul 26, 2004
Sold by
Eldayha Walid and Eldayha Roni Marie
Bought by
Eldayha Walid and Eldayha Roni Marie
Current Estimated Value
Purchase Details
Closed on
Jun 30, 1999
Sold by
Bryant Richard L
Bought by
Eldayha Walid
Purchase Details
Closed on
Jun 20, 1988
Sold by
G R G Realty Trust
Bought by
Bryant Richard L
Create a Home Valuation Report for This Property
The Home Valuation Report is an in-depth analysis detailing your home's value as well as a comparison with similar homes in the area
Home Values in the Area
Average Home Value in this Area
Purchase History
| Date | Buyer | Sale Price | Title Company |
|---|---|---|---|
| Eldayha Walid | -- | -- | |
| Eldayha Walid | $245,000 | -- | |
| Bryant Richard L | $278,500 | -- |
Source: Public Records
Mortgage History
| Date | Status | Borrower | Loan Amount |
|---|---|---|---|
| Open | Bryant Richard L | $75,000 | |
| Closed | Bryant Richard L | $100,000 |
Source: Public Records
Tax History Compared to Growth
Tax History
| Year | Tax Paid | Tax Assessment Tax Assessment Total Assessment is a certain percentage of the fair market value that is determined by local assessors to be the total taxable value of land and additions on the property. | Land | Improvement |
|---|---|---|---|---|
| 2025 | $9,629 | $704,400 | $237,100 | $467,300 |
| 2024 | $9,531 | $672,600 | $215,400 | $457,200 |
| 2023 | $8,776 | $571,000 | $186,400 | $384,600 |
| 2022 | $8,759 | $540,000 | $175,500 | $364,500 |
| 2021 | $4,882 | $499,600 | $175,500 | $324,100 |
| 2020 | $8,460 | $516,800 | $175,500 | $341,300 |
| 2019 | $5,220 | $503,000 | $175,500 | $327,500 |
| 2018 | $8,237 | $480,500 | $166,800 | $313,700 |
| 2017 | $246 | $458,500 | $151,500 | $307,000 |
| 2016 | $8,064 | $448,000 | $141,000 | $307,000 |
| 2015 | $7,747 | $435,000 | $141,000 | $294,000 |
| 2014 | $7,173 | $435,000 | $141,000 | $294,000 |
Source: Public Records
Map
Nearby Homes
- 30 Keenan St
- 158 Rowayne Park
- 464-466 Main St
- 86 Wall St
- 116 Center St
- 18 Aldrich Rd
- 10 Duck Farm Ln
- 603 East St
- 192 S Main St
- 40 Old Forge Rd Unit 40
- 224 Center St
- 211 Oak St
- 180 Main St Unit C55
- 180 Main St Unit 6-203
- Lot 1 Hammond St
- 54 Michael Rd Unit 33
- 48 Pearl St
- 92 Bryant St
- 36 Michael Rd
- 495 E Center St