Estimated Value: $240,703 - $257,000
--
Bed
1
Bath
1,532
Sq Ft
$163/Sq Ft
Est. Value
About This Home
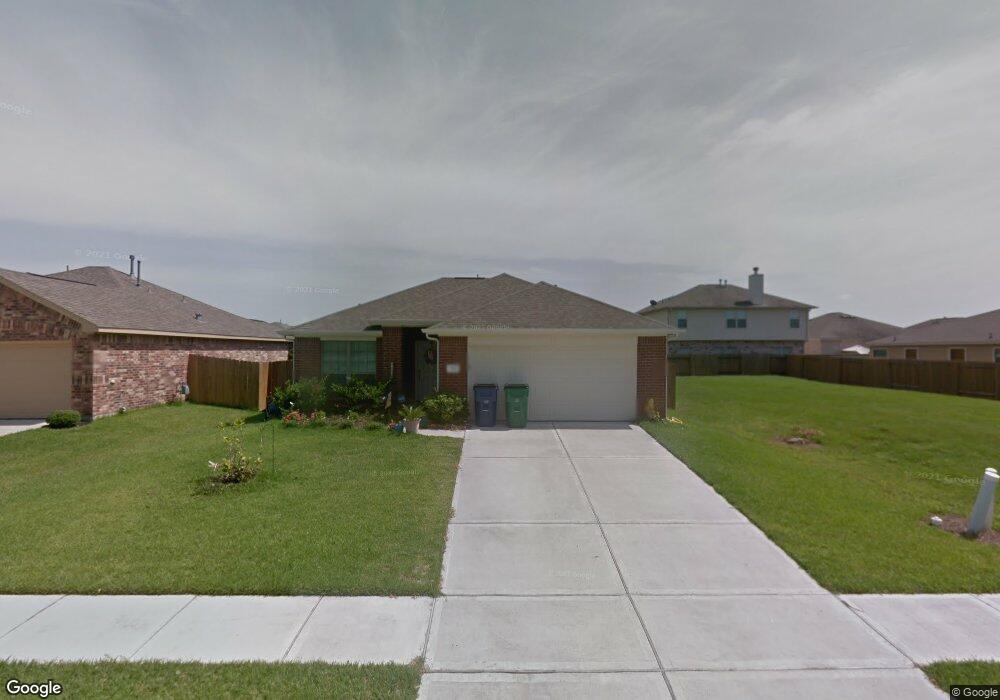
This home is located at 392 De Coster Blvd, Alvin, TX 77511 and is currently estimated at $249,426, approximately $162 per square foot. 392 De Coster Blvd is a home located in Brazoria County with nearby schools including G.W. Harby Junior High School, Alvin High School, and Living Stones Christian School.
Ownership History
Date
Name
Owned For
Owner Type
Purchase Details
Closed on
Sep 30, 2010
Sold by
Grand View Builders Inc
Bought by
Ching Laurence Patrick and Ching Harriett R
Current Estimated Value
Home Financials for this Owner
Home Financials are based on the most recent Mortgage that was taken out on this home.
Original Mortgage
$135,406
Outstanding Balance
$89,852
Interest Rate
4.46%
Mortgage Type
VA
Estimated Equity
$159,574
Purchase Details
Closed on
Aug 5, 2010
Sold by
Lots R Us 6 Lp
Bought by
Grand View Builders Inc
Home Financials for this Owner
Home Financials are based on the most recent Mortgage that was taken out on this home.
Original Mortgage
$135,406
Outstanding Balance
$89,852
Interest Rate
4.46%
Mortgage Type
VA
Estimated Equity
$159,574
Create a Home Valuation Report for This Property
The Home Valuation Report is an in-depth analysis detailing your home's value as well as a comparison with similar homes in the area
Home Values in the Area
Average Home Value in this Area
Purchase History
| Date | Buyer | Sale Price | Title Company |
|---|---|---|---|
| Ching Laurence Patrick | -- | Platinum Title Partners | |
| Grand View Builders Inc | -- | Stewart Title Houston Div |
Source: Public Records
Mortgage History
| Date | Status | Borrower | Loan Amount |
|---|---|---|---|
| Open | Ching Laurence Patrick | $135,406 | |
| Previous Owner | Grand View Builders Inc | $95,300 |
Source: Public Records
Tax History Compared to Growth
Tax History
| Year | Tax Paid | Tax Assessment Tax Assessment Total Assessment is a certain percentage of the fair market value that is determined by local assessors to be the total taxable value of land and additions on the property. | Land | Improvement |
|---|---|---|---|---|
| 2025 | $1,777 | $260,370 | $27,830 | $232,540 |
| 2023 | $1,777 | $223,015 | $27,830 | $248,160 |
| 2022 | $5,561 | $202,741 | $26,710 | $189,440 |
| 2021 | $5,321 | $184,310 | $26,710 | $157,600 |
| 2020 | $5,290 | $180,760 | $26,710 | $154,050 |
| 2019 | $5,086 | $169,330 | $22,260 | $147,070 |
| 2018 | $5,006 | $166,360 | $22,260 | $144,100 |
| 2017 | $4,793 | $157,280 | $22,260 | $135,020 |
| 2016 | $4,657 | $157,280 | $22,260 | $135,020 |
| 2014 | $3,506 | $126,310 | $22,260 | $104,050 |
Source: Public Records
Map
Nearby Homes
- 394 De Coster Blvd
- 417 De Coster Blvd
- 5690 Highway 35 Bypass
- 5323 Latigo Ct
- 5321 Latigo Ct
- 5330 Latigo Ct
- The Princeton II Plan at Kendall Lakes
- The Crawford Plan at Kendall Lakes
- The Davenport II Plan at Kendall Lakes
- The Georgetown II Plan at Kendall Lakes
- The Pearson Plan at Kendall Lakes
- The James Plan at Kendall Lakes
- The McGinnis Plan at Kendall Lakes
- 5318 Latigo Ct
- Madison Plan at Kendall Lakes
- Avery Plan at Kendall Lakes
- Elias Plan at Skyview
- Christina Plan at Kendall Lakes
- Rev Plan at Skyview
- Trenton Plan at Kendall Lakes
- 390 De Coster Blvd
- 393 Hannah Ln
- 388 De Coster Blvd
- 391 Hannah Ln
- 5229 Mcgrath Dr
- 5220 Everts Ave
- 5227 Mcgrath Dr
- 397 De Coster Blvd
- 386 De Coster Blvd
- 389 Hannah Ln
- 5225 Mcgrath Dr
- 386 Decoster Blvd
- 393 De Coster Blvd
- 395 De Coster Blvd
- 5223 Mcgrath Dr
- 391 De Coster Blvd
- 387 Hannah Ln
- 384 De Coster Blvd
- 5218 Everts Ave
- 389 Decoster Blvd