
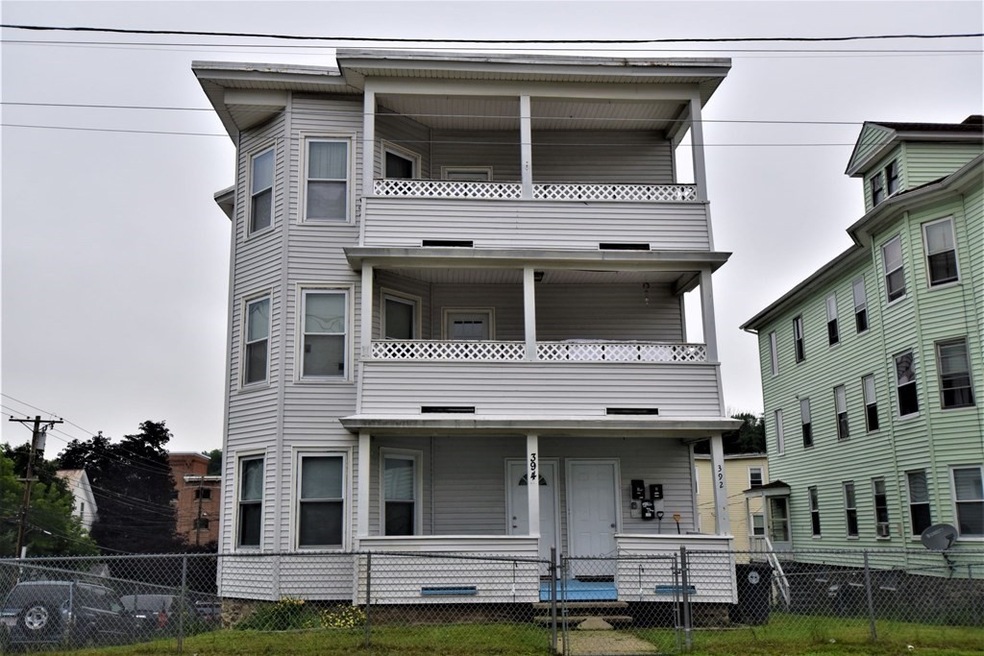
392 Hamilton St Southbridge, MA 01550
9
Beds
3
Baths
4,395
Sq Ft
5,227
Sq Ft Lot
Highlights
- Property is near public transit
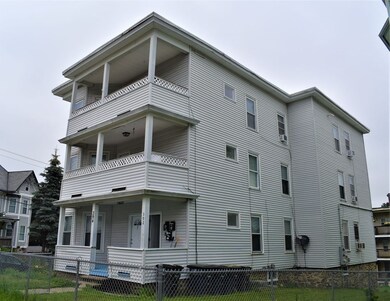
- Enclosed patio or porch
- Shops
- Corner Lot
- Park
- Coin Laundry
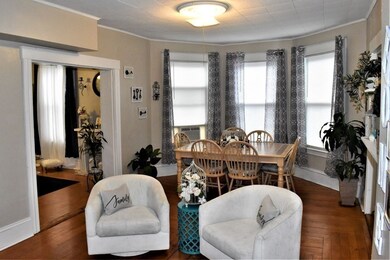
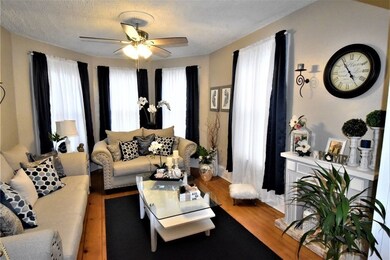
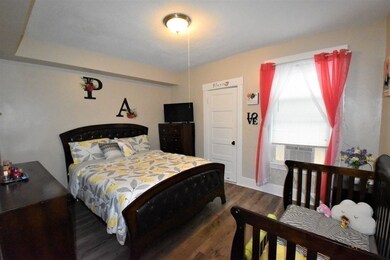
About This Home
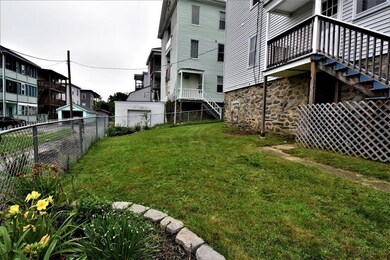
As of September 2021First showings will be at group showing with scheduled appointments, Sunday 7/18 from 12-3. Investors take notice! Fully occupied 3 family in great condition on corner lot. Each unit has 3 bedrooms and 1 bath. 2 porches, storage areas and landlord washer/dryers in each unit. Separately metered electric including landlord box. Recent updates include flooring, fresh paint and new water heater for unit 2. Delead certificates for each unit. Big fenced in yard for gardening or gatherings. Come take a look while it lasts.
Last Agent to Sell the Property
Melanie Wrightson
The Tate Team Listed on: 07/15/2021
Property Details
Home Type
- Multi-Family
Est. Annual Taxes
- $4,625
Year Built
- Built in 1900
Lot Details
- 5,227 Sq Ft Lot
- Fenced
- Corner Lot
Parking
- 4 Car Parking Spaces
Home Design
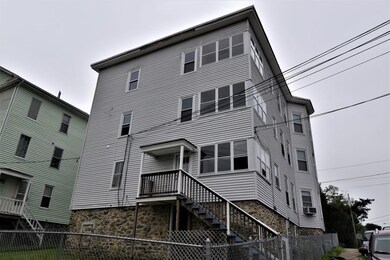
- Stone Foundation
- Tar and Gravel Roof
Interior Spaces
- 4,395 Sq Ft Home
- Insulated Windows
- Washer and Electric Dryer Hookup
Bedrooms and Bathrooms
- 9 Bedrooms
- 3 Full Bathrooms
Unfinished Basement
- Walk-Out Basement
- Basement Fills Entire Space Under The House
- Dirt Floor
Outdoor Features
- Enclosed patio or porch
Location
- Property is near public transit
- Property is near schools
Utilities
- Heating Available
- Gas Water Heater
Listing and Financial Details
- Total Actual Rent $3,600
- Rent includes unit 1(water), unit 2(water), unit 3(water)
- Assessor Parcel Number M:0034 B:0080 L:00001,3977728
Community Details
Overview
- 3 Units
- Property has 1 Level
Amenities
- Shops
- Coin Laundry
Recreation
- Park
Building Details
- Net Operating Income $43,200
Ownership History
Date
Name
Owned For
Owner Type
Purchase Details
Closed on
May 4, 2023
Sold by
Serrano Jose and Serrano Tatiana
Bought by
Serrano Tatiana
Current Estimated Value
Purchase Details
Closed on
Jan 17, 2014
Sold by
Mason Adam D and Mason Adam
Bought by
Southbridge Holdings L
Purchase Details
Closed on
Aug 3, 2009
Sold by
Bac Home Loans Svcng and Bac Gp Llc
Bought by
Imbriano Marina
Purchase Details
Closed on
Dec 8, 2008
Sold by
Beaulieu Scott R and Countrywide Home Loans
Bought by
Hsbc Bank Usa
Purchase Details
Closed on
Jun 6, 2005
Sold by
Darkoma Sarah and Darkoma Thomas
Bought by
Beaulieu Scott R
Purchase Details
Closed on
Mar 6, 2002
Sold by
Peckham Paul E and Peckham Kim S
Bought by
Darkoma Thomas and Darkoma Sarah
Purchase Details
Closed on
Sep 6, 1996
Sold by
Dupuis Marc P
Bought by
Peckham Paul E and Peckham Kim
Similar Home in Southbridge, MA
Create a Home Valuation Report for This Property
The Home Valuation Report is an in-depth analysis detailing your home's value as well as a comparison with similar homes in the area
Home Values in the Area
Average Home Value in this Area
Purchase History
| Date | Type | Sale Price | Title Company |
|---|---|---|---|
| Quit Claim Deed | -- | None Available | |
| Quit Claim Deed | -- | None Available | |
| Deed | -- | -- | |
| Deed | -- | -- | |
| Deed | $101,000 | -- | |
| Deed | $101,000 | -- | |
| Foreclosure Deed | $226,950 | -- | |
| Foreclosure Deed | $226,950 | -- | |
| Deed | $235,900 | -- | |
| Deed | $235,900 | -- | |
| Deed | $104,000 | -- | |
| Deed | $104,000 | -- | |
| Deed | $75,000 | -- | |
| Deed | $75,000 | -- |
Source: Public Records
Mortgage History
| Date | Status | Loan Amount | Loan Type |
|---|---|---|---|
| Previous Owner | $288,750 | Purchase Money Mortgage | |
| Previous Owner | $241,105 | FHA | |
| Previous Owner | $242,948 | FHA | |
| Previous Owner | $244,489 | FHA | |
| Previous Owner | $111,675 | No Value Available | |
| Previous Owner | $81,937 | New Conventional |
Source: Public Records
Property History
| Date | Event | Price | Change | Sq Ft Price |
|---|---|---|---|---|
| 09/14/2021 09/14/21 | Sold | $385,000 | +7.0% | $88 / Sq Ft |
| 07/22/2021 07/22/21 | Pending | -- | -- | -- |
| 07/15/2021 07/15/21 | For Sale | $359,900 | +44.5% | $82 / Sq Ft |
| 12/21/2018 12/21/18 | Sold | $249,000 | -4.2% | $57 / Sq Ft |
| 10/12/2018 10/12/18 | Pending | -- | -- | -- |
| 10/12/2018 10/12/18 | For Sale | $259,900 | 0.0% | $59 / Sq Ft |
| 10/11/2018 10/11/18 | Pending | -- | -- | -- |
| 09/23/2018 09/23/18 | For Sale | $259,900 | +137.9% | $59 / Sq Ft |
| 03/22/2013 03/22/13 | Sold | $109,250 | -8.9% | $22 / Sq Ft |
| 02/20/2013 02/20/13 | Pending | -- | -- | -- |
| 10/01/2012 10/01/12 | For Sale | $119,900 | -- | $24 / Sq Ft |
Source: MLS Property Information Network (MLS PIN)
Tax History Compared to Growth
Tax History
| Year | Tax Paid | Tax Assessment Tax Assessment Total Assessment is a certain percentage of the fair market value that is determined by local assessors to be the total taxable value of land and additions on the property. | Land | Improvement |
|---|---|---|---|---|
| 2025 | $7,386 | $503,800 | $27,200 | $476,600 |
| 2024 | $6,353 | $416,300 | $13,600 | $402,700 |
| 2023 | $5,881 | $371,300 | $13,600 | $357,700 |
| 2022 | $4,649 | $259,700 | $11,600 | $248,100 |
| 2021 | $4,625 | $237,900 | $11,600 | $226,300 |
| 2020 | $4,330 | $222,300 | $11,600 | $210,700 |
| 2018 | $3,274 | $157,800 | $16,800 | $141,000 |
| 2017 | $3,246 | $157,800 | $16,800 | $141,000 |
| 2016 | $2,945 | $145,700 | $16,800 | $128,900 |
| 2015 | $3,032 | $148,900 | $18,100 | $130,800 |
| 2014 | $2,924 | $148,900 | $18,100 | $130,800 |
Source: Public Records
Agents Affiliated with this Home
-
M
Seller's Agent in 2021
Melanie Wrightson
The Tate Team
-
Buyer's Agent in 2021
Leonidas Dosreis
Property Investors & Advisors, LLC
(508) 843-0447
4 in this area
83 Total Sales
-
Seller's Agent in 2018
Wendy McFarland
RE/MAX
(774) 280-4956
16 in this area
49 Total Sales
-
Seller's Agent in 2013
Danielle Therrien
Its My Real Estate
(508) 344-3481
54 Total Sales
-
C
Buyer's Agent in 2013
Chris Ganger
Beck & Call REALTORS®
(774) 764-7914
4 Total Sales
Map
Source: MLS Property Information Network (MLS PIN)
MLS Number: 72866623
APN: SBRI-000034-000080-000001
Disclaimer: Certain information contained herein is derived from information provided by parties other than Homes.com. All information provided is deemed reliable, but is not guaranteed to be accurate and should be independently verified.
![]() The property listing data and information, or the Images, set forth herein were provided to MLS Property Information Network, Inc. from third party sources, including sellers, lessors and public records, and were compiled by MLS Property Information Network, Inc. The property listing data and information, and the Images, are for the personal, non-commercial use of consumers having a good faith interest in purchasing or leasing listed properties of the type displayed to them and may not be used for any purpose other than to identify prospective properties which such consumers may have a good faith interest in purchasing or leasing. MLS Property Information Network, Inc. and its subscribers disclaim any and all representations and warranties as to the accuracy of the property listing data and information, or as to the accuracy of any of the Images, set forth herein.
The property listing data and information, or the Images, set forth herein were provided to MLS Property Information Network, Inc. from third party sources, including sellers, lessors and public records, and were compiled by MLS Property Information Network, Inc. The property listing data and information, and the Images, are for the personal, non-commercial use of consumers having a good faith interest in purchasing or leasing listed properties of the type displayed to them and may not be used for any purpose other than to identify prospective properties which such consumers may have a good faith interest in purchasing or leasing. MLS Property Information Network, Inc. and its subscribers disclaim any and all representations and warranties as to the accuracy of the property listing data and information, or as to the accuracy of any of the Images, set forth herein.
Nearby Homes
- 127 Cliff St
- 41 Edwards St
- 28 Plimpton St
- 45 South St
- 21 Orchard St
- 111 Plimpton St
- 31 Hamilton St
- 143 Clemence Hill Rd
- 338 Main St
- 318 Main St
- 20 Glover St
- 97 Worcester St
- 22 Worcester St
- 174 Clemence Hill Rd
- 16 Wardwell Ct
- 44 Highland St
- 111 Highfield Dr
- 28 Litchfield Ave
- 36 Litchfield Ave
- 243 Clemence Hill Rd