
Seller's Agent in 2018
Tara Coveney
Coldwell Banker Realty - Hingham
(617) 823-9781
260 Total Sales
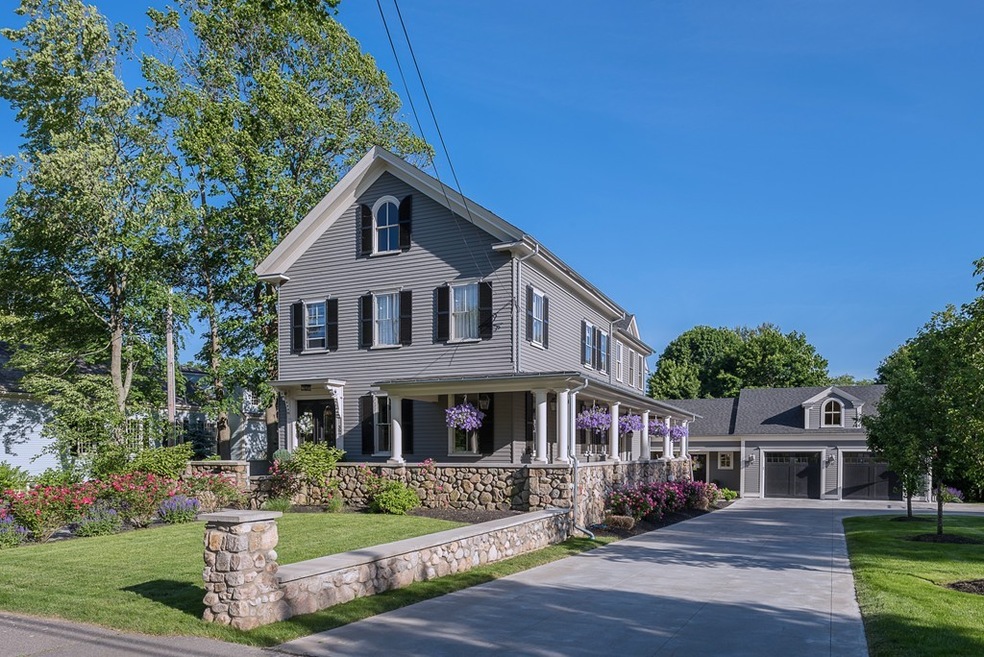
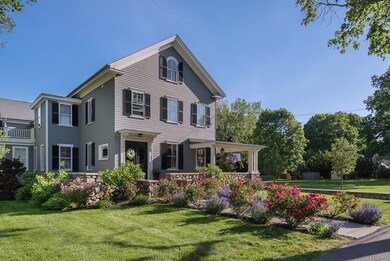

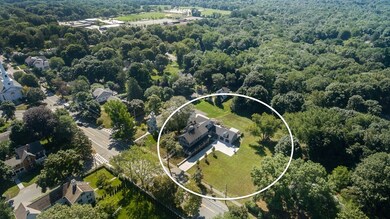


EXQUISITE home on a beautiful, 1.3 acre level lot in the heart of sought-after Hingham Center with all the benefits of newer construction in an area of classic, historic homes. The existing home was extensively and masterfully renovated and expanded in 2015 to accommodate today's living. Lovely details of the original Italianate Victorian have been retained, while the home now offers a modern, top of the line infrastructure. This 5 bed/6 bath home has an OPEN floor plan with exceptional millwork. Expansive chef's kitchen with high-end appliances, butler's pantry and double islands open to the spacious family room with coffered ceilings and custom built-ins. The first floor also offers a living room, formal dining room, guest suite/office w/private bath, 2 mud rooms and a sun filled breakfast room. The master suite is simply LUXURIOUS with steam shower and radiant floors. Four additional bedrooms with 4 full baths. Walkable to the playground, high school and town fields.
| Date | Type | Sale Price | Title Company |
|---|---|---|---|
| Not Resolvable | $2,576,250 | -- | |
| Not Resolvable | $2,541,456 | -- | |
| Not Resolvable | $765,000 | -- |
| Date | Status | Loan Amount | Loan Type |
|---|---|---|---|
| Open | $1,250,000 | Adjustable Rate Mortgage/ARM | |
| Previous Owner | $1,524,873 | Purchase Money Mortgage | |
| Previous Owner | $765,000 | Purchase Money Mortgage |
| Date | Event | Price | Change | Sq Ft Price |
|---|---|---|---|---|
| 08/29/2018 08/29/18 | Sold | $2,576,250 | -4.5% | $368 / Sq Ft |
| 07/14/2018 07/14/18 | Pending | -- | -- | -- |
| 06/05/2018 06/05/18 | Price Changed | $2,699,000 | -1.8% | $386 / Sq Ft |
| 04/04/2018 04/04/18 | Price Changed | $2,749,000 | -1.8% | $393 / Sq Ft |
| 02/22/2018 02/22/18 | For Sale | $2,799,000 | +10.1% | $400 / Sq Ft |
| 09/15/2015 09/15/15 | Sold | $2,541,456 | 0.0% | $424 / Sq Ft |
| 08/28/2015 08/28/15 | Pending | -- | -- | -- |
| 08/15/2015 08/15/15 | Off Market | $2,541,456 | -- | -- |
| 05/27/2015 05/27/15 | Price Changed | $2,649,000 | -5.2% | $442 / Sq Ft |
| 05/06/2015 05/06/15 | Price Changed | $2,794,000 | -5.3% | $466 / Sq Ft |
| 04/02/2015 04/02/15 | For Sale | $2,949,000 | +285.5% | $492 / Sq Ft |
| 07/31/2013 07/31/13 | Sold | $765,000 | -7.8% | $228 / Sq Ft |
| 05/24/2013 05/24/13 | Pending | -- | -- | -- |
| 05/22/2013 05/22/13 | For Sale | $829,921 | 0.0% | $247 / Sq Ft |
| 05/20/2013 05/20/13 | Pending | -- | -- | -- |
| 05/15/2013 05/15/13 | For Sale | $829,921 | -- | $247 / Sq Ft |
| Year | Tax Paid | Tax Assessment Tax Assessment Total Assessment is a certain percentage of the fair market value that is determined by local assessors to be the total taxable value of land and additions on the property. | Land | Improvement |
|---|---|---|---|---|
| 2025 | $49,065 | $4,589,800 | $784,100 | $3,805,700 |
| 2024 | $38,435 | $3,542,400 | $784,100 | $2,758,300 |
| 2023 | $7,841 | $784,100 | $784,100 | $0 |
| 2022 | $7,764 | $671,600 | $671,600 | $0 |
| 2021 | $30,706 | $2,602,200 | $671,600 | $1,930,600 |
| 2020 | $30,003 | $2,602,200 | $671,600 | $1,930,600 |
| 2019 | $29,842 | $2,526,800 | $671,600 | $1,855,200 |
| 2018 | $29,703 | $2,523,600 | $671,600 | $1,852,000 |
| 2017 | $28,746 | $2,346,600 | $669,400 | $1,677,200 |
| 2016 | $19,095 | $1,528,800 | $637,600 | $891,200 |
| 2015 | $9,597 | $765,900 | $627,200 | $138,700 |
Seller's Agent in 2018
Tara Coveney
Coldwell Banker Realty - Hingham
(617) 823-9781
260 Total Sales
Buyer's Agent in 2018
Christine Sypek
Coldwell Banker Realty - Hingham
(781) 856-0211
83 Total Sales
Seller's Agent in 2015
Darleen Lannon
William Raveis R.E. & Home Services
(617) 899-4508
278 Total Sales
Buyer's Agent in 2015
Paul Reardon
William Raveis R.E. & Home Services
(781) 395-7676
82 Total Sales
Seller's Agent in 2013
John Balzano
Century 21 North East
(617) 694-0590
53 Total Sales
Buyer's Agent in 2013
Kerrin Rowley
Coldwell Banker Realty - Hingham
(781) 710-8350
104 Total Sales
Source: MLS Property Information Network (MLS PIN)
MLS Number: 72284898
APN: HING-000090-000000-000074
Disclaimer: Certain information contained herein is derived from information provided by parties other than Homes.com. All information provided is deemed reliable, but is not guaranteed to be accurate and should be independently verified.
![]() The property listing data and information, or the Images, set forth herein were provided to MLS Property Information Network, Inc. from third party sources, including sellers, lessors and public records, and were compiled by MLS Property Information Network, Inc. The property listing data and information, and the Images, are for the personal, non-commercial use of consumers having a good faith interest in purchasing or leasing listed properties of the type displayed to them and may not be used for any purpose other than to identify prospective properties which such consumers may have a good faith interest in purchasing or leasing. MLS Property Information Network, Inc. and its subscribers disclaim any and all representations and warranties as to the accuracy of the property listing data and information, or as to the accuracy of any of the Images, set forth herein.
The property listing data and information, or the Images, set forth herein were provided to MLS Property Information Network, Inc. from third party sources, including sellers, lessors and public records, and were compiled by MLS Property Information Network, Inc. The property listing data and information, and the Images, are for the personal, non-commercial use of consumers having a good faith interest in purchasing or leasing listed properties of the type displayed to them and may not be used for any purpose other than to identify prospective properties which such consumers may have a good faith interest in purchasing or leasing. MLS Property Information Network, Inc. and its subscribers disclaim any and all representations and warranties as to the accuracy of the property listing data and information, or as to the accuracy of any of the Images, set forth herein.