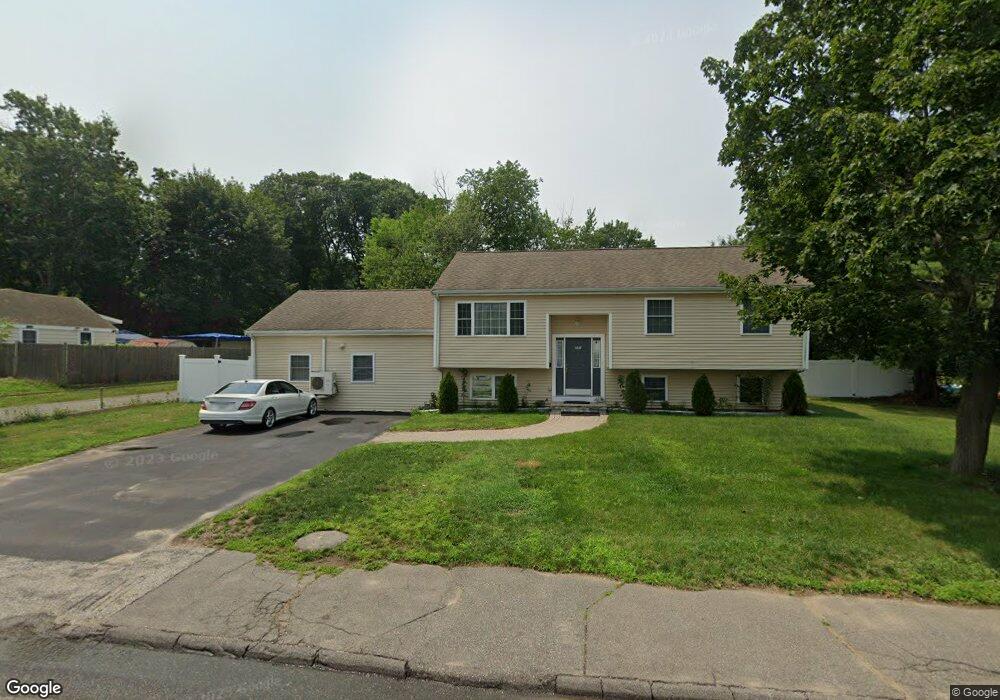
392 Shaw St Braintree, MA 02184
East Braintree NeighborhoodEstimated Value: $794,668 - $902,000
5
Beds
2
Baths
2,940
Sq Ft
$288/Sq Ft
Est. Value
About This Home
This home is located at 392 Shaw St, Braintree, MA 02184 and is currently estimated at $845,917, approximately $287 per square foot. 392 Shaw St is a home located in Norfolk County with nearby schools including Braintree High School, Noble Academy, and Sacred Heart Elementary School.
Ownership History
Date
Name
Owned For
Owner Type
Purchase Details
Closed on
Apr 28, 2003
Sold by
Ferreira Josimar
Bought by
Alves Jose and Alves Valquiria
Current Estimated Value
Home Financials for this Owner
Home Financials are based on the most recent Mortgage that was taken out on this home.
Original Mortgage
$342,000
Outstanding Balance
$147,015
Interest Rate
5.64%
Mortgage Type
Purchase Money Mortgage
Estimated Equity
$698,902
Purchase Details
Closed on
Feb 28, 2002
Sold by
Scioscia Eugene M and Scioscia Ann F
Bought by
Ferreira Josimar
Home Financials for this Owner
Home Financials are based on the most recent Mortgage that was taken out on this home.
Original Mortgage
$275,500
Interest Rate
6.85%
Mortgage Type
Purchase Money Mortgage
Create a Home Valuation Report for This Property
The Home Valuation Report is an in-depth analysis detailing your home's value as well as a comparison with similar homes in the area
Home Values in the Area
Average Home Value in this Area
Purchase History
| Date | Buyer | Sale Price | Title Company |
|---|---|---|---|
| Alves Jose | $360,000 | -- | |
| Ferreira Josimar | $290,000 | -- |
Source: Public Records
Mortgage History
| Date | Status | Borrower | Loan Amount |
|---|---|---|---|
| Open | Alves Jose | $342,000 | |
| Previous Owner | Ferreira Josimar | $275,500 |
Source: Public Records
Tax History
| Year | Tax Paid | Tax Assessment Tax Assessment Total Assessment is a certain percentage of the fair market value that is determined by local assessors to be the total taxable value of land and additions on the property. | Land | Improvement |
|---|---|---|---|---|
| 2025 | $7,060 | $707,400 | $346,500 | $360,900 |
| 2024 | $6,414 | $676,600 | $320,300 | $356,300 |
| 2023 | $6,137 | $628,800 | $294,000 | $334,800 |
| 2022 | $6,048 | $607,800 | $273,000 | $334,800 |
| 2021 | $5,731 | $576,000 | $252,000 | $324,000 |
| 2020 | $5,679 | $576,000 | $252,000 | $324,000 |
| 2019 | $5,566 | $551,600 | $252,000 | $299,600 |
| 2018 | $4,883 | $463,300 | $199,500 | $263,800 |
| 2017 | $4,584 | $426,800 | $178,500 | $248,300 |
| 2016 | $4,371 | $398,100 | $157,500 | $240,600 |
| 2015 | $4,315 | $389,800 | $151,200 | $238,600 |
| 2014 | $4,149 | $363,300 | $151,200 | $212,100 |
Source: Public Records
Map
Nearby Homes
- 30 Skyline Dr Unit 6
- 312 Shaw St
- 25 W Howard St Unit C3
- 26 Tingley Rd
- 16 Beechwood Rd
- 200 Falls Blvd Unit B305
- 51 Faxon St
- 41 Lantern Ln
- 37 Lantern Ln
- 342 Elm St
- 255 River St
- 585 Washington St Unit 202
- 585 Washington St Unit model
- 17 White Rd
- 51 Sumner St
- 122 Washington St Unit Twenty-two
- 155 Kendrick Ave Unit 502
- 97 Sumner St Unit 1
- 62 Lawn Ave
- 7-9 Kittredge Ave
Your Personal Tour Guide
Ask me questions while you tour the home.