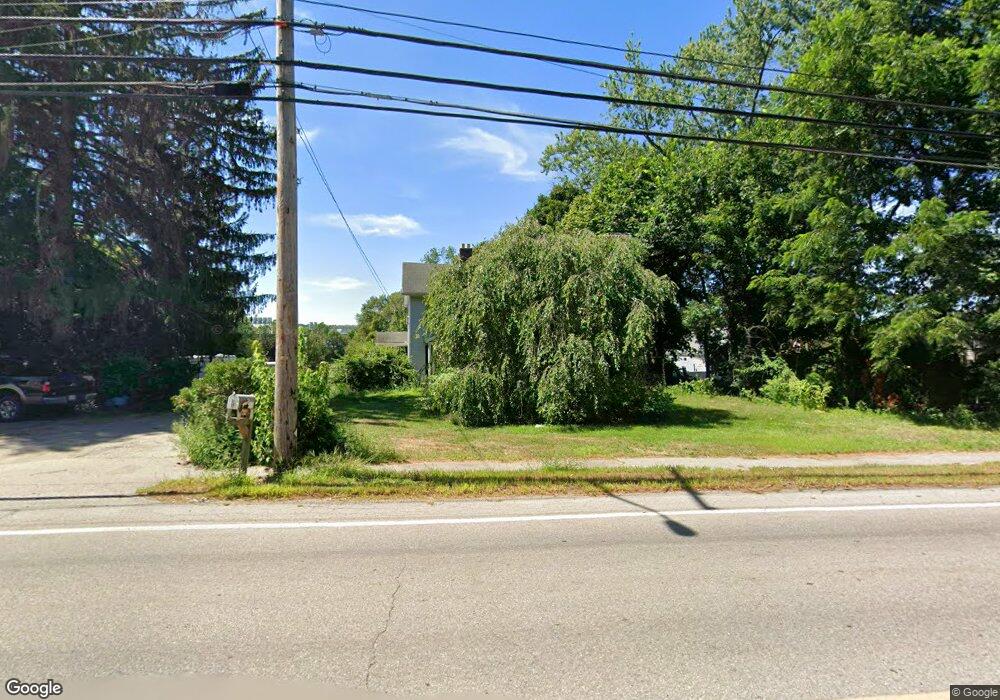
392 South St Plainville, MA 02762
Estimated Value: $504,000 - $585,000
3
Beds
1
Bath
1,344
Sq Ft
$402/Sq Ft
Est. Value
About This Home
This home is located at 392 South St, Plainville, MA 02762 and is currently estimated at $539,892, approximately $401 per square foot. 392 South St is a home located in Norfolk County with nearby schools including Anna Ware Jackson School, Beatrice H. Wood Elementary School, and Cadence Academy Preschool - North Attleborough.
Ownership History
Date
Name
Owned For
Owner Type
Purchase Details
Closed on
Aug 31, 2001
Sold by
Drakopoulos Crystal
Bought by
Lukas John S and Lukas Deborah E
Current Estimated Value
Home Financials for this Owner
Home Financials are based on the most recent Mortgage that was taken out on this home.
Original Mortgage
$192,000
Interest Rate
7.06%
Mortgage Type
Purchase Money Mortgage
Purchase Details
Closed on
Dec 30, 1998
Sold by
Ethier Paul A and Ethier Grace K
Bought by
Drakopoulos Crystal
Home Financials for this Owner
Home Financials are based on the most recent Mortgage that was taken out on this home.
Original Mortgage
$164,915
Interest Rate
6.84%
Mortgage Type
Purchase Money Mortgage
Create a Home Valuation Report for This Property
The Home Valuation Report is an in-depth analysis detailing your home's value as well as a comparison with similar homes in the area
Home Values in the Area
Average Home Value in this Area
Purchase History
| Date | Buyer | Sale Price | Title Company |
|---|---|---|---|
| Lukas John S | $240,000 | -- | |
| Drakopoulos Crystal | $165,000 | -- |
Source: Public Records
Mortgage History
| Date | Status | Borrower | Loan Amount |
|---|---|---|---|
| Open | Drakopoulos Crystal | $192,000 | |
| Closed | Lukas John S | $192,000 | |
| Previous Owner | Drakopoulos Crystal | $164,915 | |
| Previous Owner | Drakopoulos Crystal | $100,000 |
Source: Public Records
Tax History Compared to Growth
Tax History
| Year | Tax Paid | Tax Assessment Tax Assessment Total Assessment is a certain percentage of the fair market value that is determined by local assessors to be the total taxable value of land and additions on the property. | Land | Improvement |
|---|---|---|---|---|
| 2025 | $48 | $411,200 | $232,800 | $178,400 |
| 2024 | $4,649 | $387,400 | $212,800 | $174,600 |
| 2023 | $4,615 | $369,800 | $212,800 | $157,000 |
| 2022 | $4,497 | $320,500 | $205,300 | $115,200 |
| 2021 | $4,517 | $307,300 | $205,300 | $102,000 |
| 2020 | $4,454 | $303,000 | $205,300 | $97,700 |
| 2019 | $4,614 | $308,200 | $205,300 | $102,900 |
| 2018 | $4,360 | $289,500 | $186,600 | $102,900 |
| 2017 | $4,259 | $283,900 | $186,600 | $97,300 |
| 2016 | $4,149 | $279,800 | $186,600 | $93,200 |
| 2015 | $4,035 | $261,700 | $161,300 | $100,400 |
| 2014 | $3,934 | $263,000 | $161,300 | $101,700 |
Source: Public Records
Map
Nearby Homes
- 387 South St
- 12 Grant St
- 4 Munroe Dr
- 80 Willow Ln
- 1222 South St
- 19 Chestnut Lot 0
- 29 Broad St
- 19 Valerie Dr
- 5 Farm Hill Ln
- 11 Amber Dr
- 50 Green St
- 158 Washington St
- 126 Washington St
- 130 Washington St
- 124 Washington St
- 45 Moran St
- 102 High St
- 791 South St Unit 5
- 9 Sunnyside Dr Unit 9
- 35-R Whiting St